# What is Haystack?

## Welcome

Haystack helps deliver software better. We do this by creating tools which integrates with issue tracker & version control.

We want to help **engineering teams** to deliver software **more effectively** by providing **visibility & great experience**.&#x20;

Our mission is to make a **single place for team managers** to **keep delivery on track**

## Discover Haystack <a href="#discover-gitbook" id="discover-gitbook"></a>

<table data-view="cards" data-full-width="false"><thead><tr><th></th><th></th><th></th><th data-hidden data-card-cover data-type="files"></th><th data-hidden data-card-target data-type="content-ref"></th></tr></thead><tbody><tr><td><strong>Effective Standups</strong></td><td>Get status updates in 10 second</td><td></td><td><a href="/files/Bcw34HKAdWB7s06CMHtl">/files/Bcw34HKAdWB7s06CMHtl</a></td><td><a href="/pages/GBHVyFLIvZVfSOofx6dQ">/pages/GBHVyFLIvZVfSOofx6dQ</a></td></tr><tr><td><strong>Unblock Pull Request</strong></td><td>See PRs that requires your attention</td><td></td><td><a href="/files/QOsqsSX3z4kaBLiQyB02">/files/QOsqsSX3z4kaBLiQyB02</a></td><td><a href="/pages/ULtr3SQxTRAZz0ymaKlZ">/pages/ULtr3SQxTRAZz0ymaKlZ</a></td></tr><tr><td><strong>Epic Progress</strong></td><td>Prevent last minute roadmap delays</td><td></td><td><a href="/files/I0VZYgFq9ePNl8iXK7ir">/files/I0VZYgFq9ePNl8iXK7ir</a></td><td><a href="/pages/j5bMJtG7rVBKyebh4mq6">/pages/j5bMJtG7rVBKyebh4mq6</a></td></tr><tr><td><strong>Retrospective</strong></td><td>Complete view of your sprint, and why you missed your goals.</td><td></td><td><a href="/files/rfEtjIUumVRui5spcMWa">/files/rfEtjIUumVRui5spcMWa</a></td><td><a href="/pages/ZbZusX98yLdTsEKVQKhK">/pages/ZbZusX98yLdTsEKVQKhK</a></td></tr><tr><td><strong>Release Notes</strong></td><td>Streamline communication with outside your teams</td><td></td><td><a href="/files/4DY8nhfxXrh5dMWNkCXN">/files/4DY8nhfxXrh5dMWNkCXN</a></td><td><a href="/pages/3WCAGooI7z4GvKjocwbW">/pages/3WCAGooI7z4GvKjocwbW</a></td></tr><tr><td><strong>Flexible Reports</strong></td><td>Easy metrics across Git &#x26; Jira</td><td></td><td><a href="/files/fE22RrS7wEhl4ghpg5zl">/files/fE22RrS7wEhl4ghpg5zl</a></td><td><a href="/pages/5THboSO3zKUyjyO9kFT9">/pages/5THboSO3zKUyjyO9kFT9</a></td></tr></tbody></table>

## Product Demo

{% embed url="<https://www.loom.com/share/ba56c3ef35274b2aa997417d47ff3348?sid=8d272a74-35c3-4c87-a409-6cc45b08b7f6>" %}


# Quick Start

<figure><img src="/files/dvqJ5DneLYGrR0RrN7fO" alt=""><figcaption></figcaption></figure>

Haystack helps deliver software better by being an abstraction layer on top of issue tracker & version control designed specifically for engineering leadership.&#x20;

<table data-card-size="large" data-view="cards" data-full-width="true"><thead><tr><th></th><th></th><th></th><th data-hidden data-card-cover data-type="files"></th><th data-hidden data-card-target data-type="content-ref"></th></tr></thead><tbody><tr><td><strong>Initial Account Setup</strong></td><td>Configure your account </td><td></td><td><a href="/files/rfEtjIUumVRui5spcMWa">/files/rfEtjIUumVRui5spcMWa</a></td><td><a href="/pages/KAZveo6r4xFhtq6ePMqB">/pages/KAZveo6r4xFhtq6ePMqB</a></td></tr><tr><td><strong>Feature List</strong></td><td>See all features</td><td></td><td><a href="/files/4DY8nhfxXrh5dMWNkCXN">/files/4DY8nhfxXrh5dMWNkCXN</a></td><td><a href="https://haystack-1.gitbook.io/delivery-helpcenter/">https://haystack-1.gitbook.io/delivery-helpcenter/</a></td></tr></tbody></table>

<table data-view="cards"><thead><tr><th></th><th></th><th></th><th data-hidden data-card-cover data-type="files"></th></tr></thead><tbody><tr><td><strong>For Executives</strong></td><td>Reporting leadership</td><td></td><td><a href="/files/Bcw34HKAdWB7s06CMHtl">/files/Bcw34HKAdWB7s06CMHtl</a></td></tr><tr><td><strong>For Managers</strong></td><td>Streamline delivery</td><td></td><td><a href="/files/QOsqsSX3z4kaBLiQyB02">/files/QOsqsSX3z4kaBLiQyB02</a></td></tr><tr><td><strong>For Product</strong></td><td>Visibility on  deliverables</td><td></td><td><a href="/files/I0VZYgFq9ePNl8iXK7ir">/files/I0VZYgFq9ePNl8iXK7ir</a></td></tr></tbody></table>


# Account Setup

## Configure Account

### Setup integrations

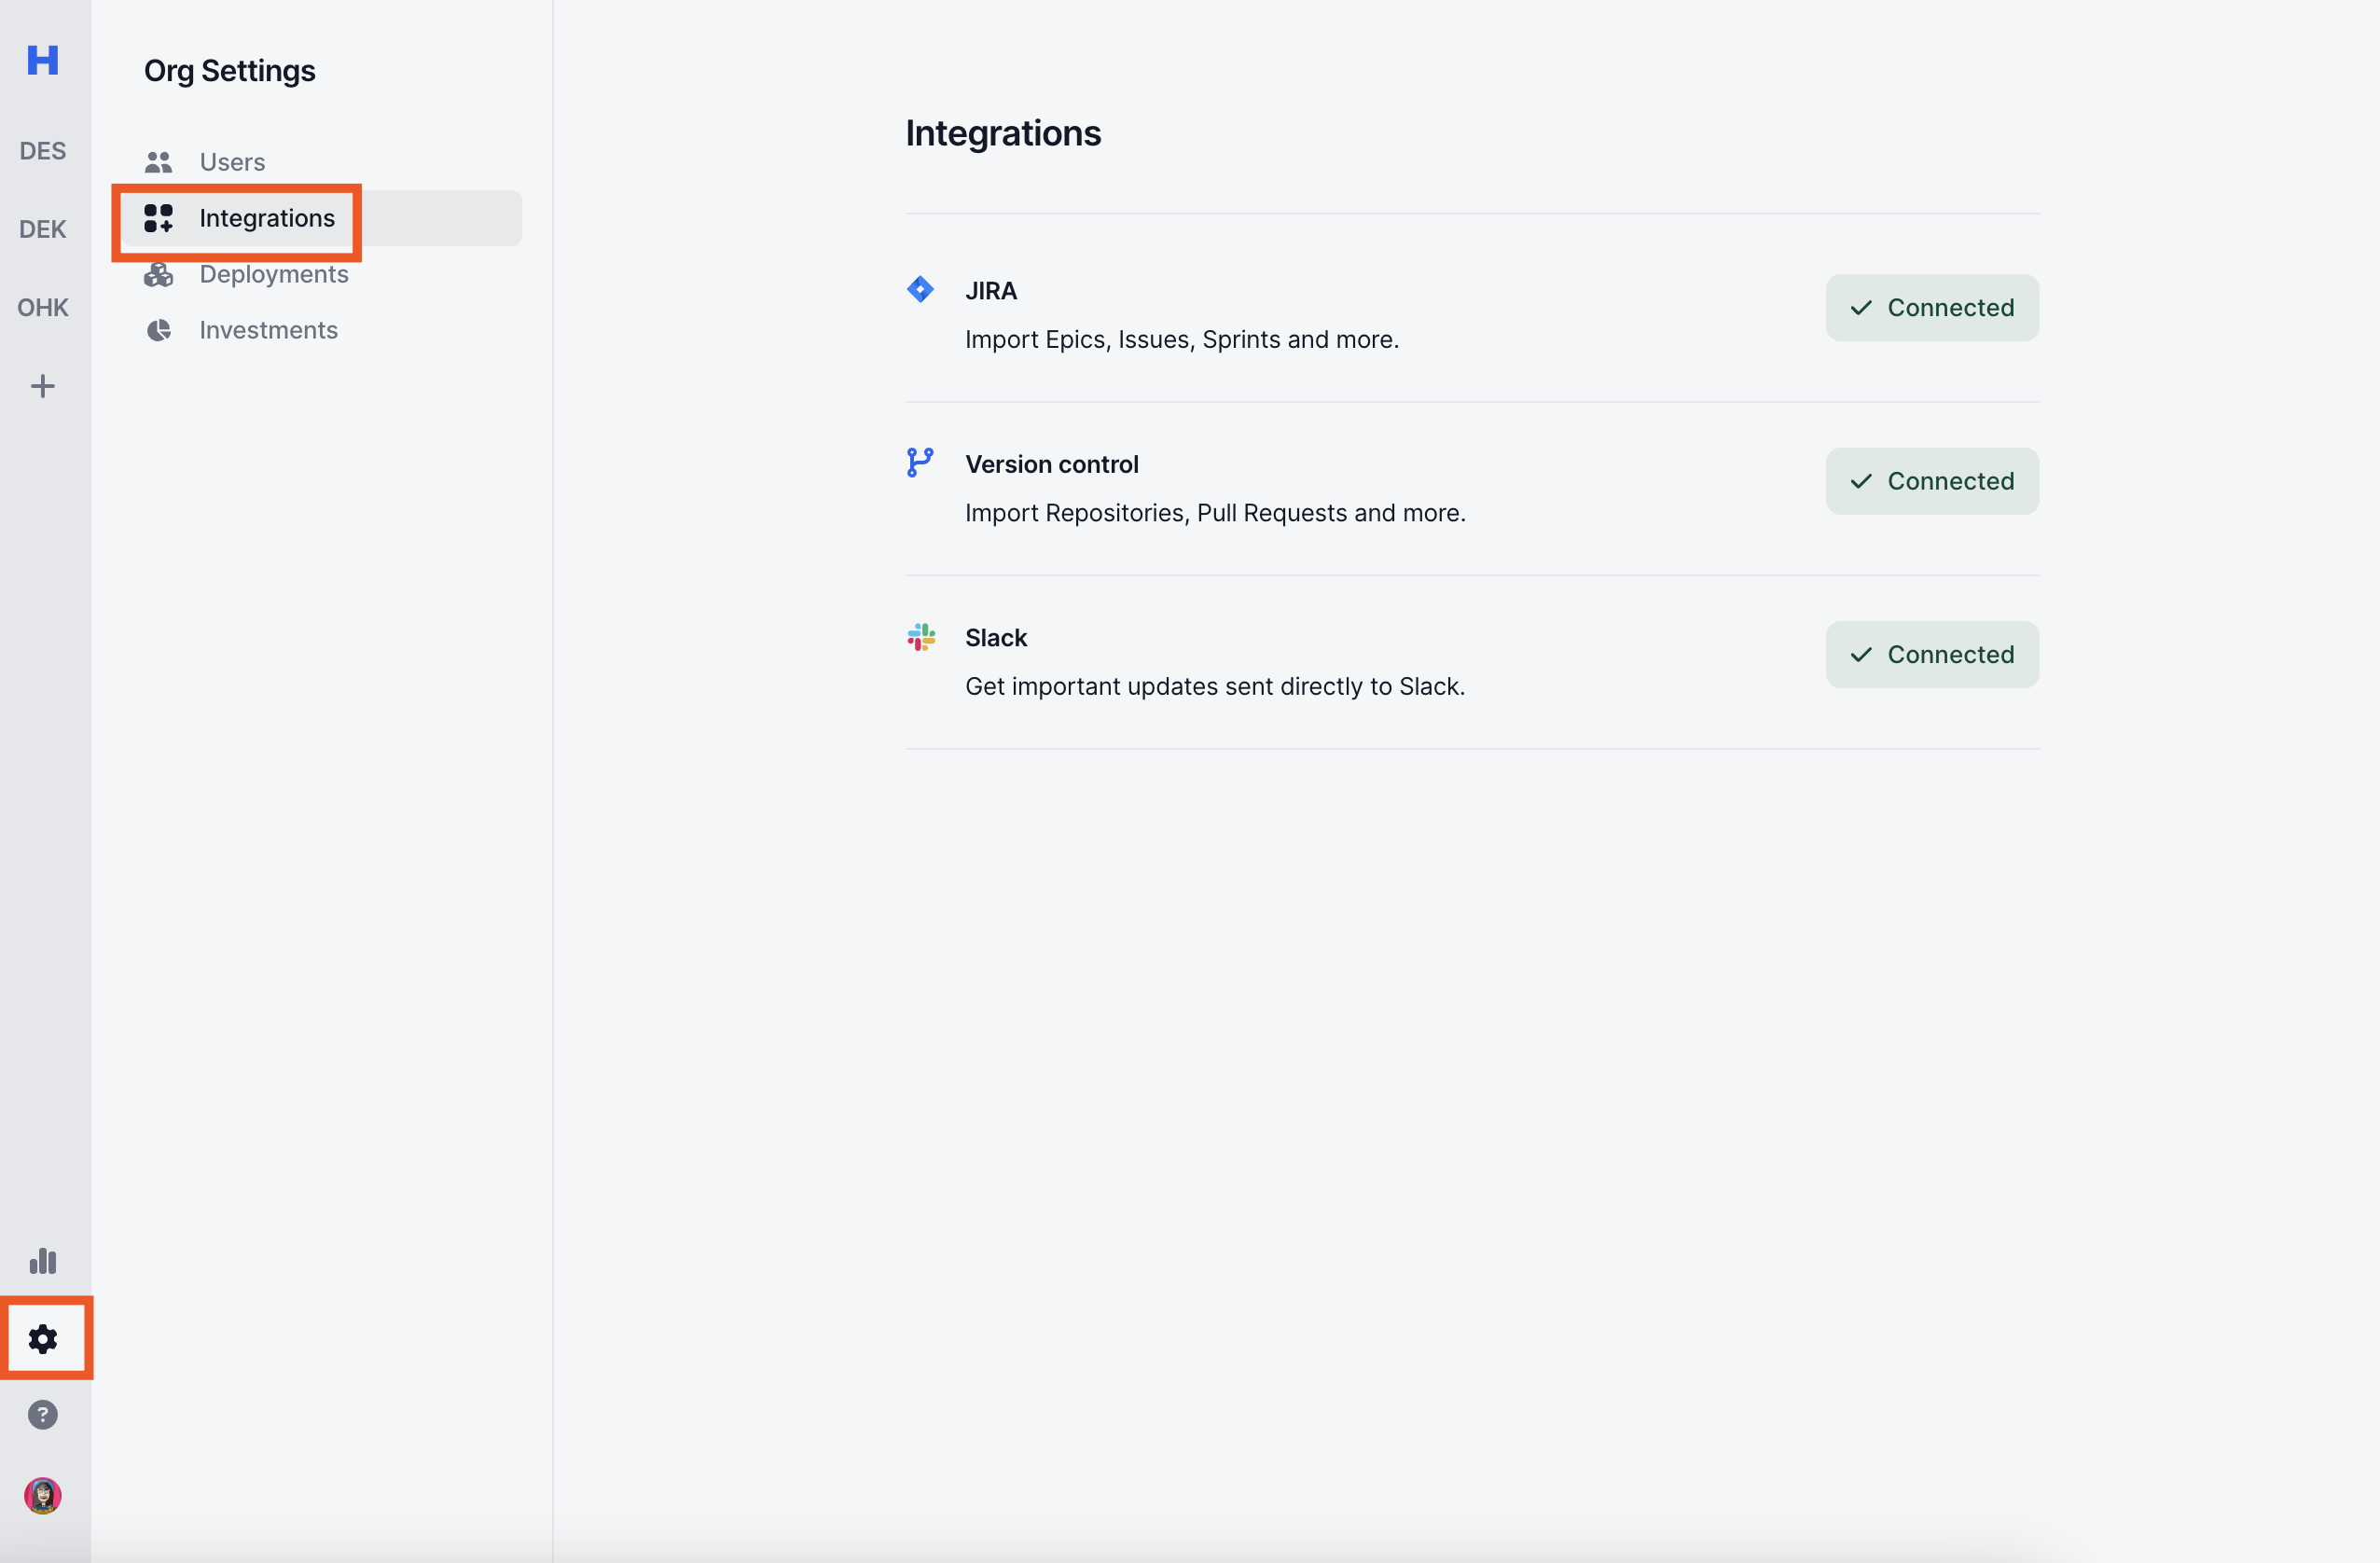
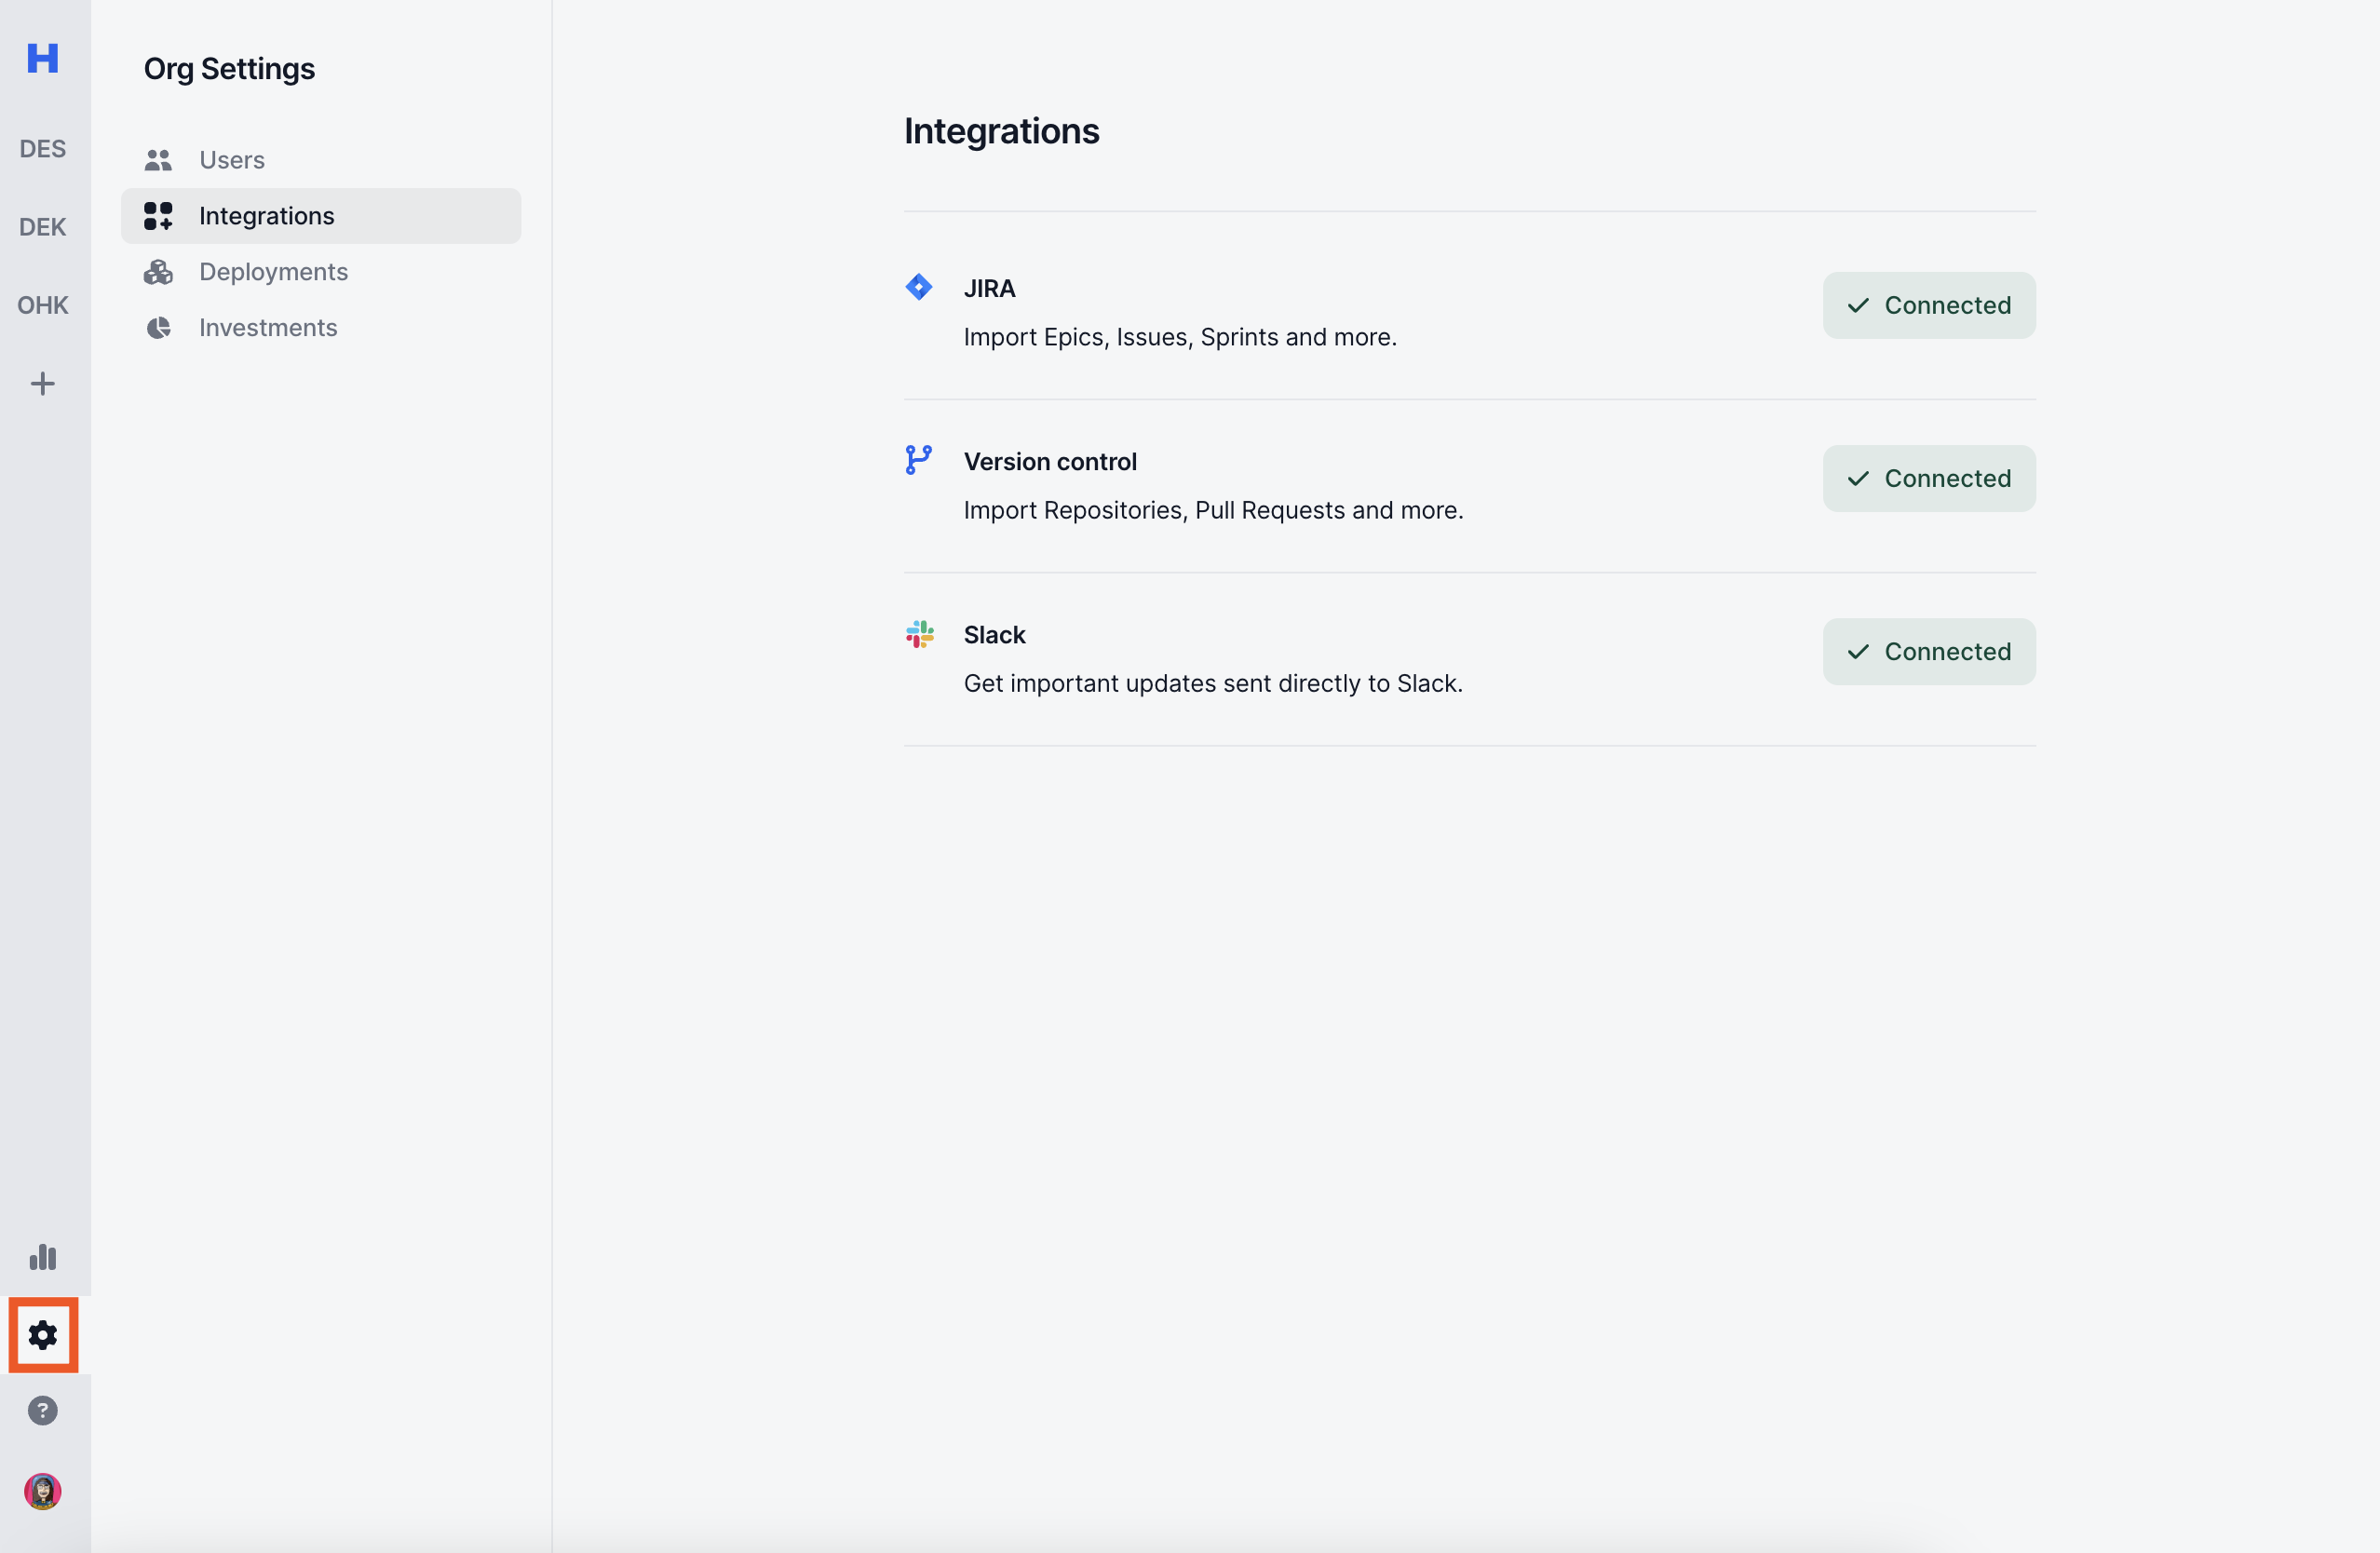
You can setup integration by going to [Organization Settings -> Integrations page](https://delivery.usehaystack.io/integrations)

Learn how to setup your [Integrations](/setup/integrations)

<figure><img src="https://cdn.zappy.app/122ba7fe1521e6f21a57a3cb5d3f1103.png" alt=""><figcaption></figcaption></figure>

### Create your first team

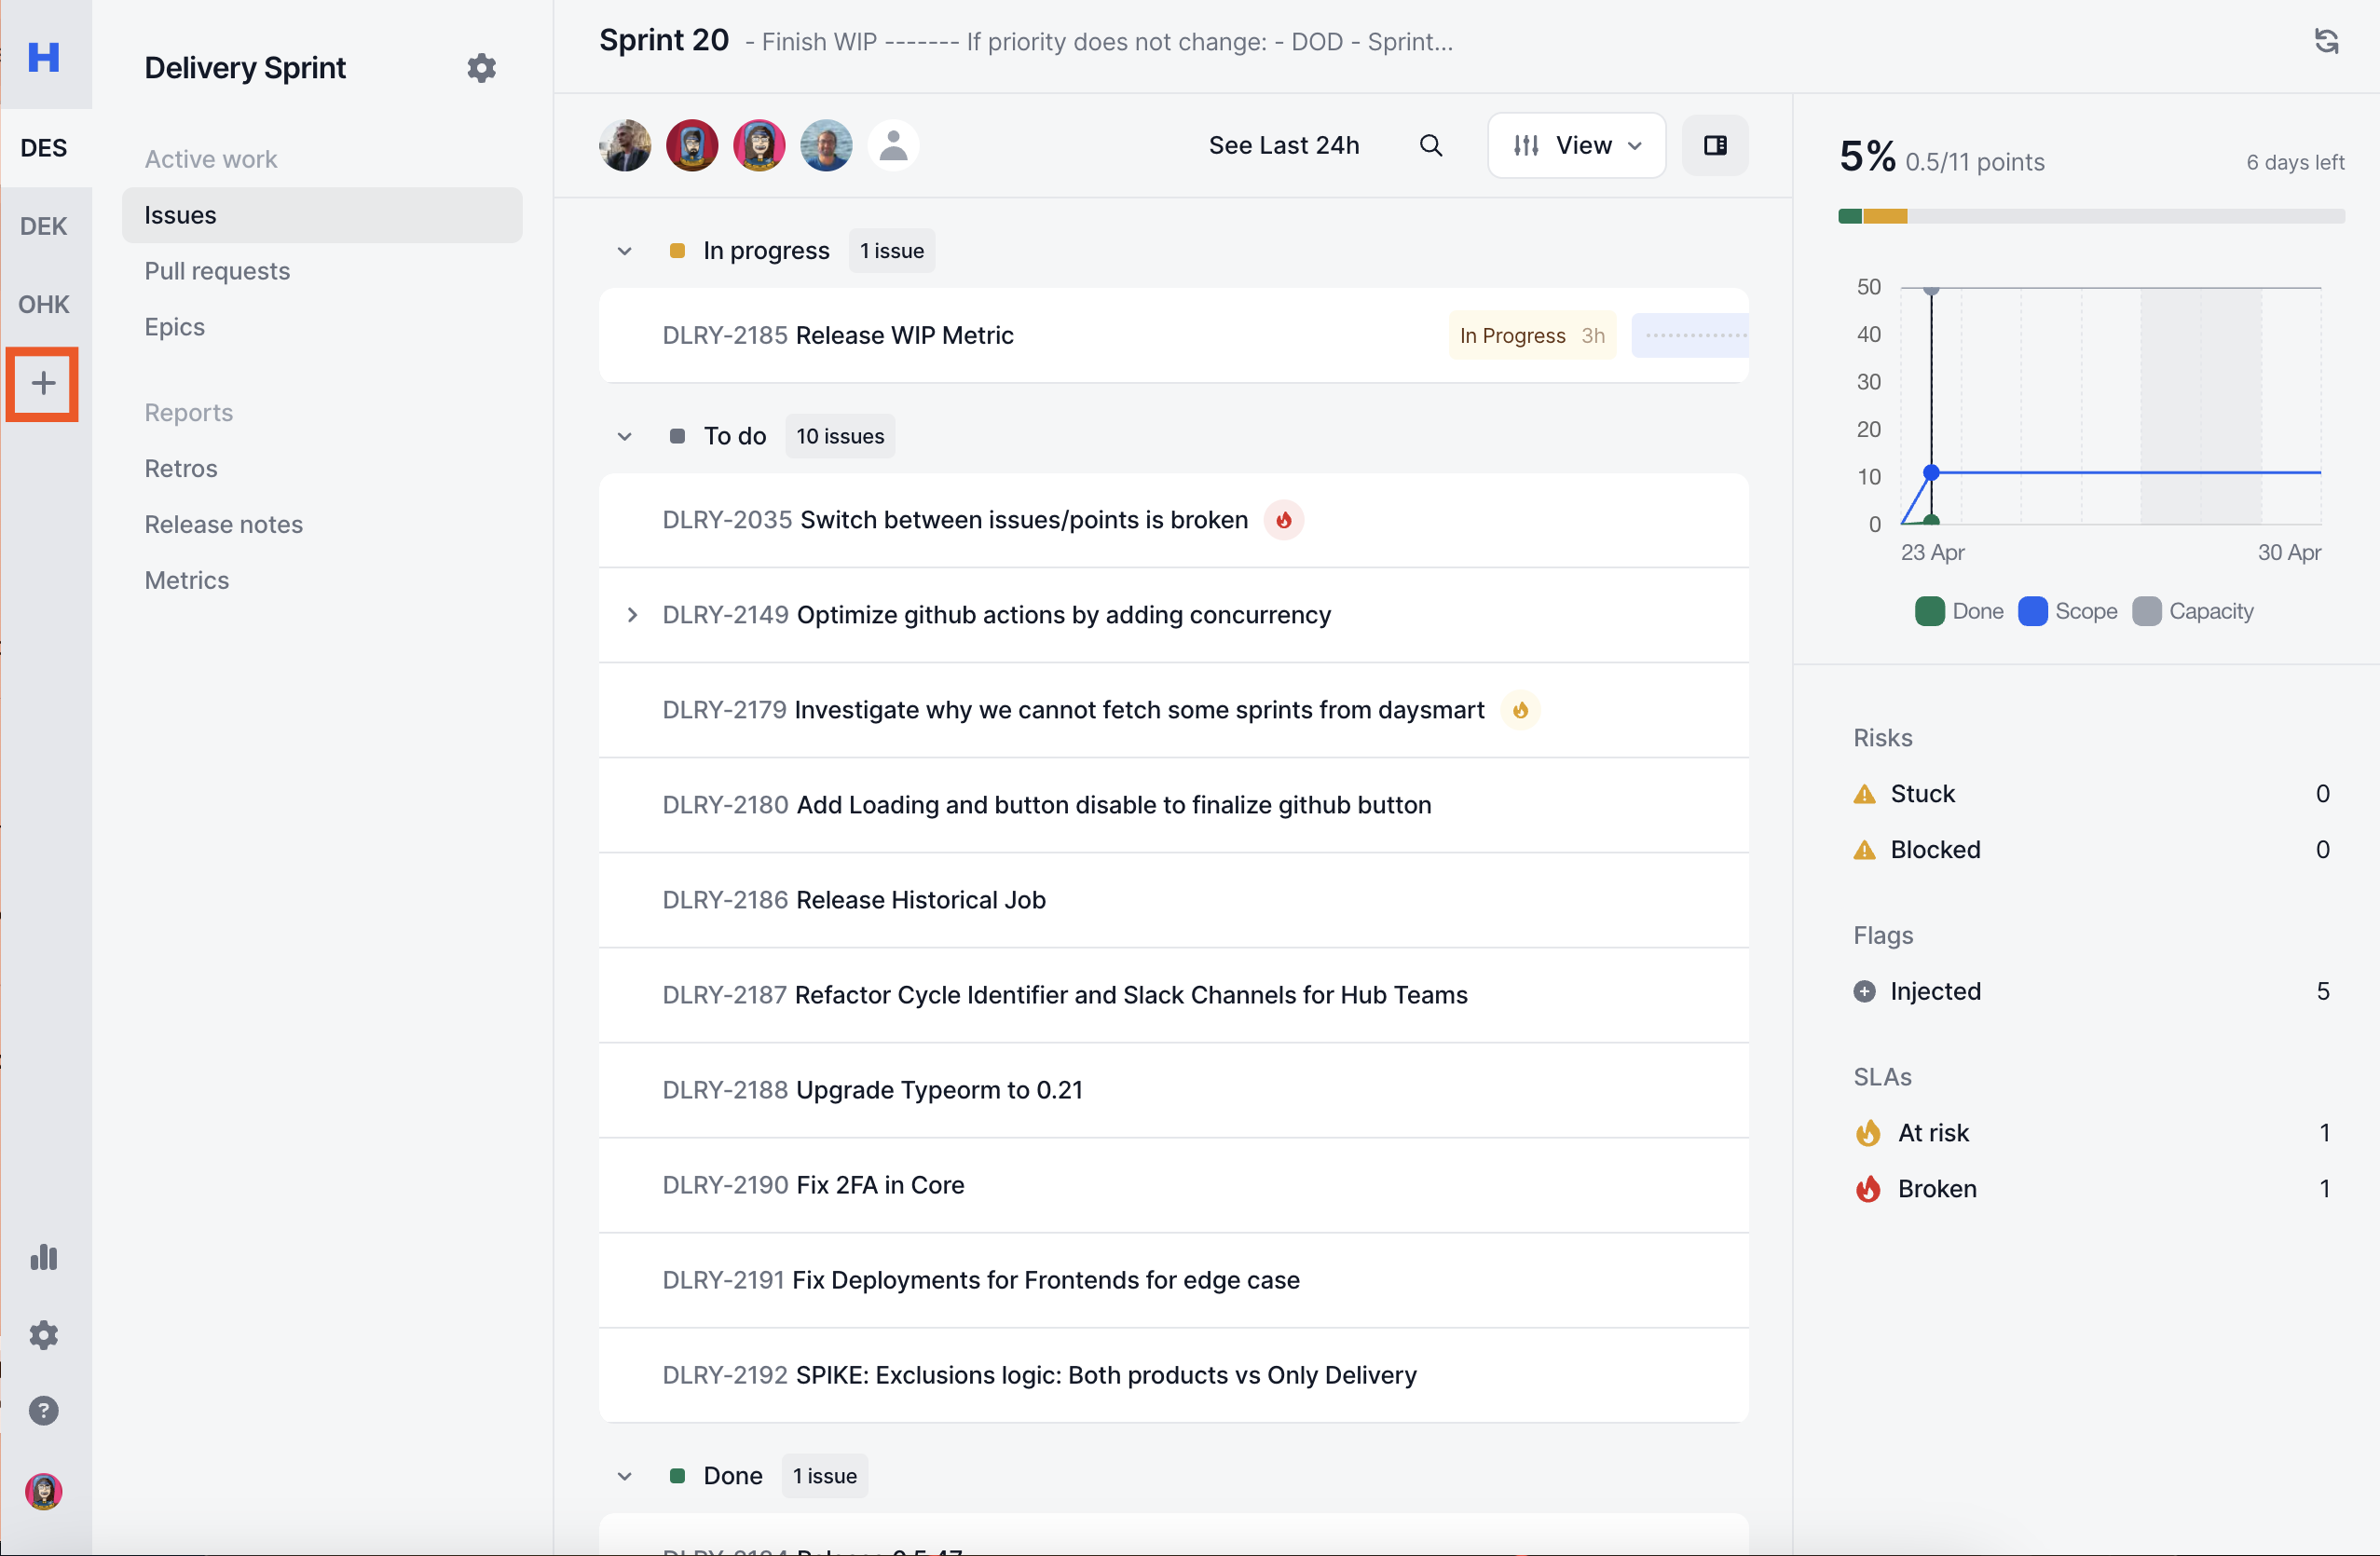
Haystack has it's own abstraction of teams. You can create a new team from the plus button in the sidebar

Learn how to create your [first team](/setup/teams).

<figure><img src="https://cdn.zappy.app/4b8eceb53f9f3c4aefc6b906d5ca711a.png" alt=""><figcaption></figcaption></figure>

### Invite others

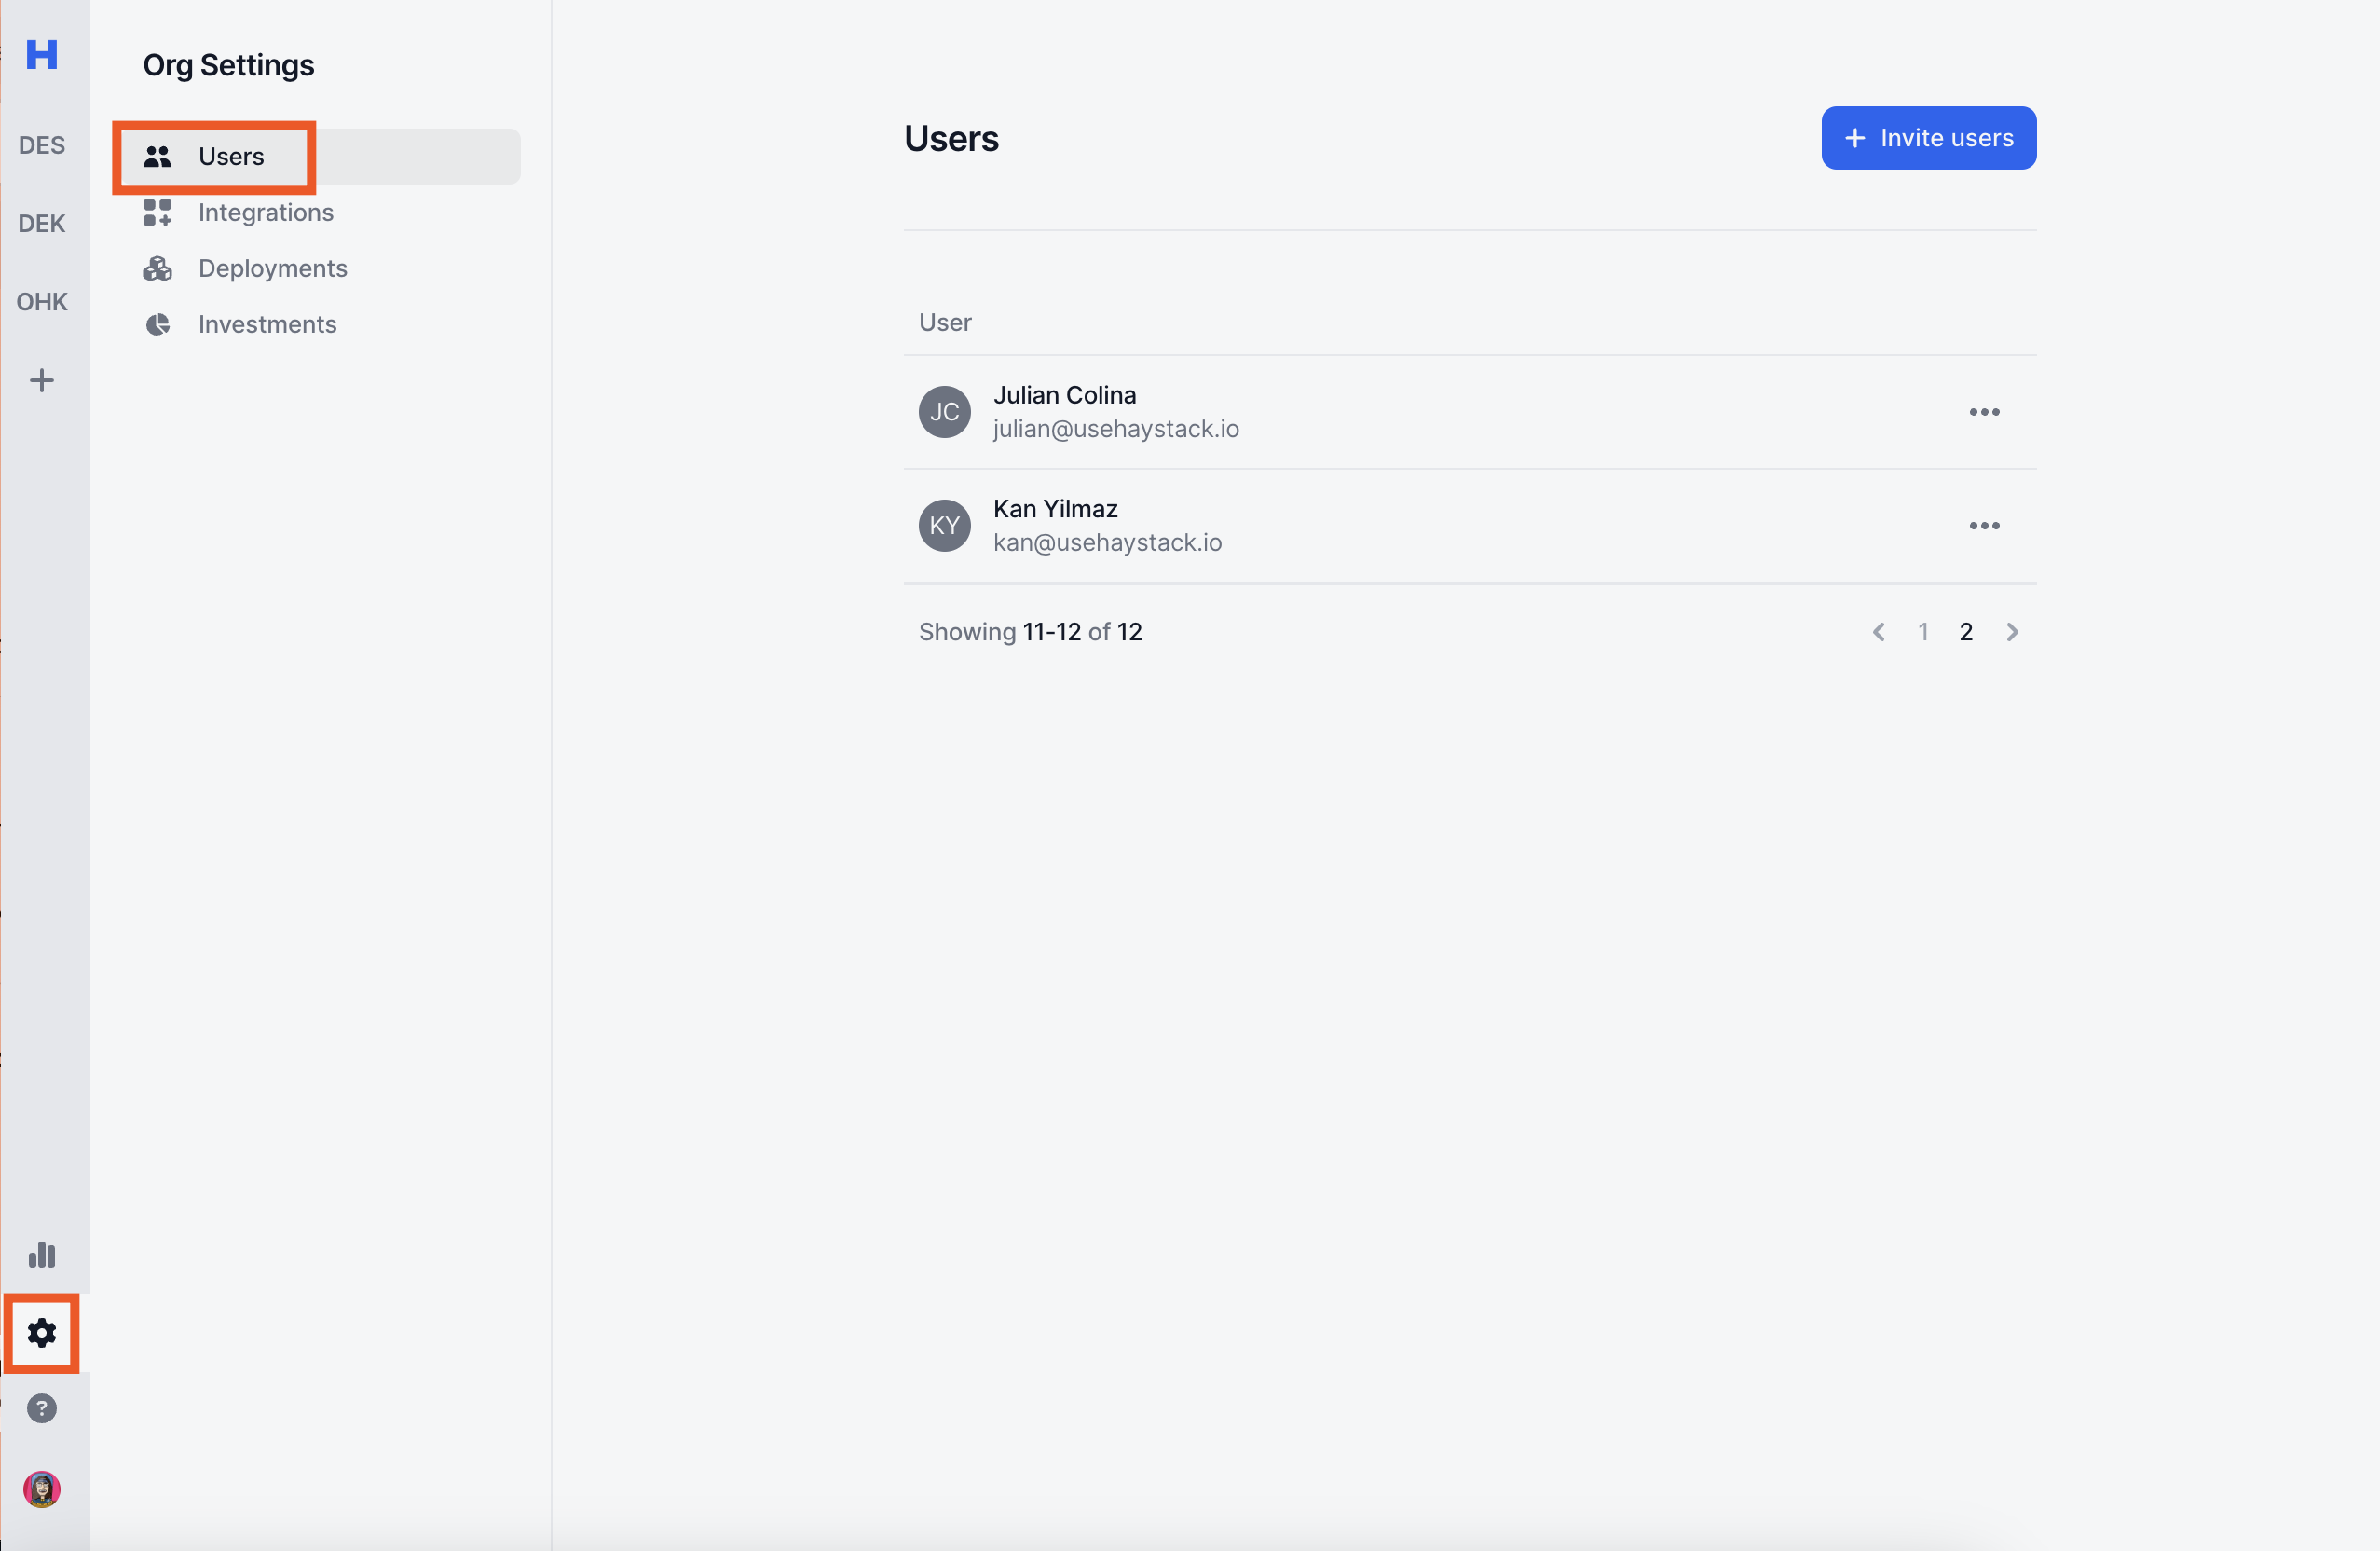
Visit [users page ](https://delivery.usehaystack.io/users)to invite engineering managers, agile coaches & product managers.&#x20;

<figure><img src="https://cdn.zappy.app/a01b5df7948b50005398e0150dfd56b8.png" alt=""><figcaption></figcaption></figure>


# Roles

Explore what you should care about the most

Each role handles different parts of delivery. Haystack helps the whole process of planning, delivery, and reporting aspects.&#x20;

See which one you care about the most.&#x20;

<table data-view="cards"><thead><tr><th></th><th></th><th></th><th data-hidden data-card-cover data-type="files"></th><th data-hidden data-card-target data-type="content-ref"></th></tr></thead><tbody><tr><td><strong>For Executives</strong></td><td>Reporting leadership</td><td></td><td><a href="/files/Bcw34HKAdWB7s06CMHtl">/files/Bcw34HKAdWB7s06CMHtl</a></td><td><a href="/pages/cz8YRcKVpv2la1rJuT1s">/pages/cz8YRcKVpv2la1rJuT1s</a></td></tr><tr><td><strong>For Managers</strong></td><td>Streamline delivery</td><td></td><td><a href="/files/QOsqsSX3z4kaBLiQyB02">/files/QOsqsSX3z4kaBLiQyB02</a></td><td><a href="/pages/nnlvKEhvjUHdcsHfPROP">/pages/nnlvKEhvjUHdcsHfPROP</a></td></tr><tr><td><strong>For Product</strong></td><td>Visibility on  deliverables</td><td></td><td><a href="/files/I0VZYgFq9ePNl8iXK7ir">/files/I0VZYgFq9ePNl8iXK7ir</a></td><td><a href="/pages/KYSyjBcLefBcZ6NsaNhr">/pages/KYSyjBcLefBcZ6NsaNhr</a></td></tr></tbody></table>


# For Executives

### Create your first team

Haystack has it's own abstraction of teams. You can create a new team from the plus button in the sidebar

Learn how to create your [first team](/setup/teams).

<figure><img src="https://cdn.zappy.app/4b8eceb53f9f3c4aefc6b906d5ca711a.png" alt=""><figcaption></figcaption></figure>

## Use cases

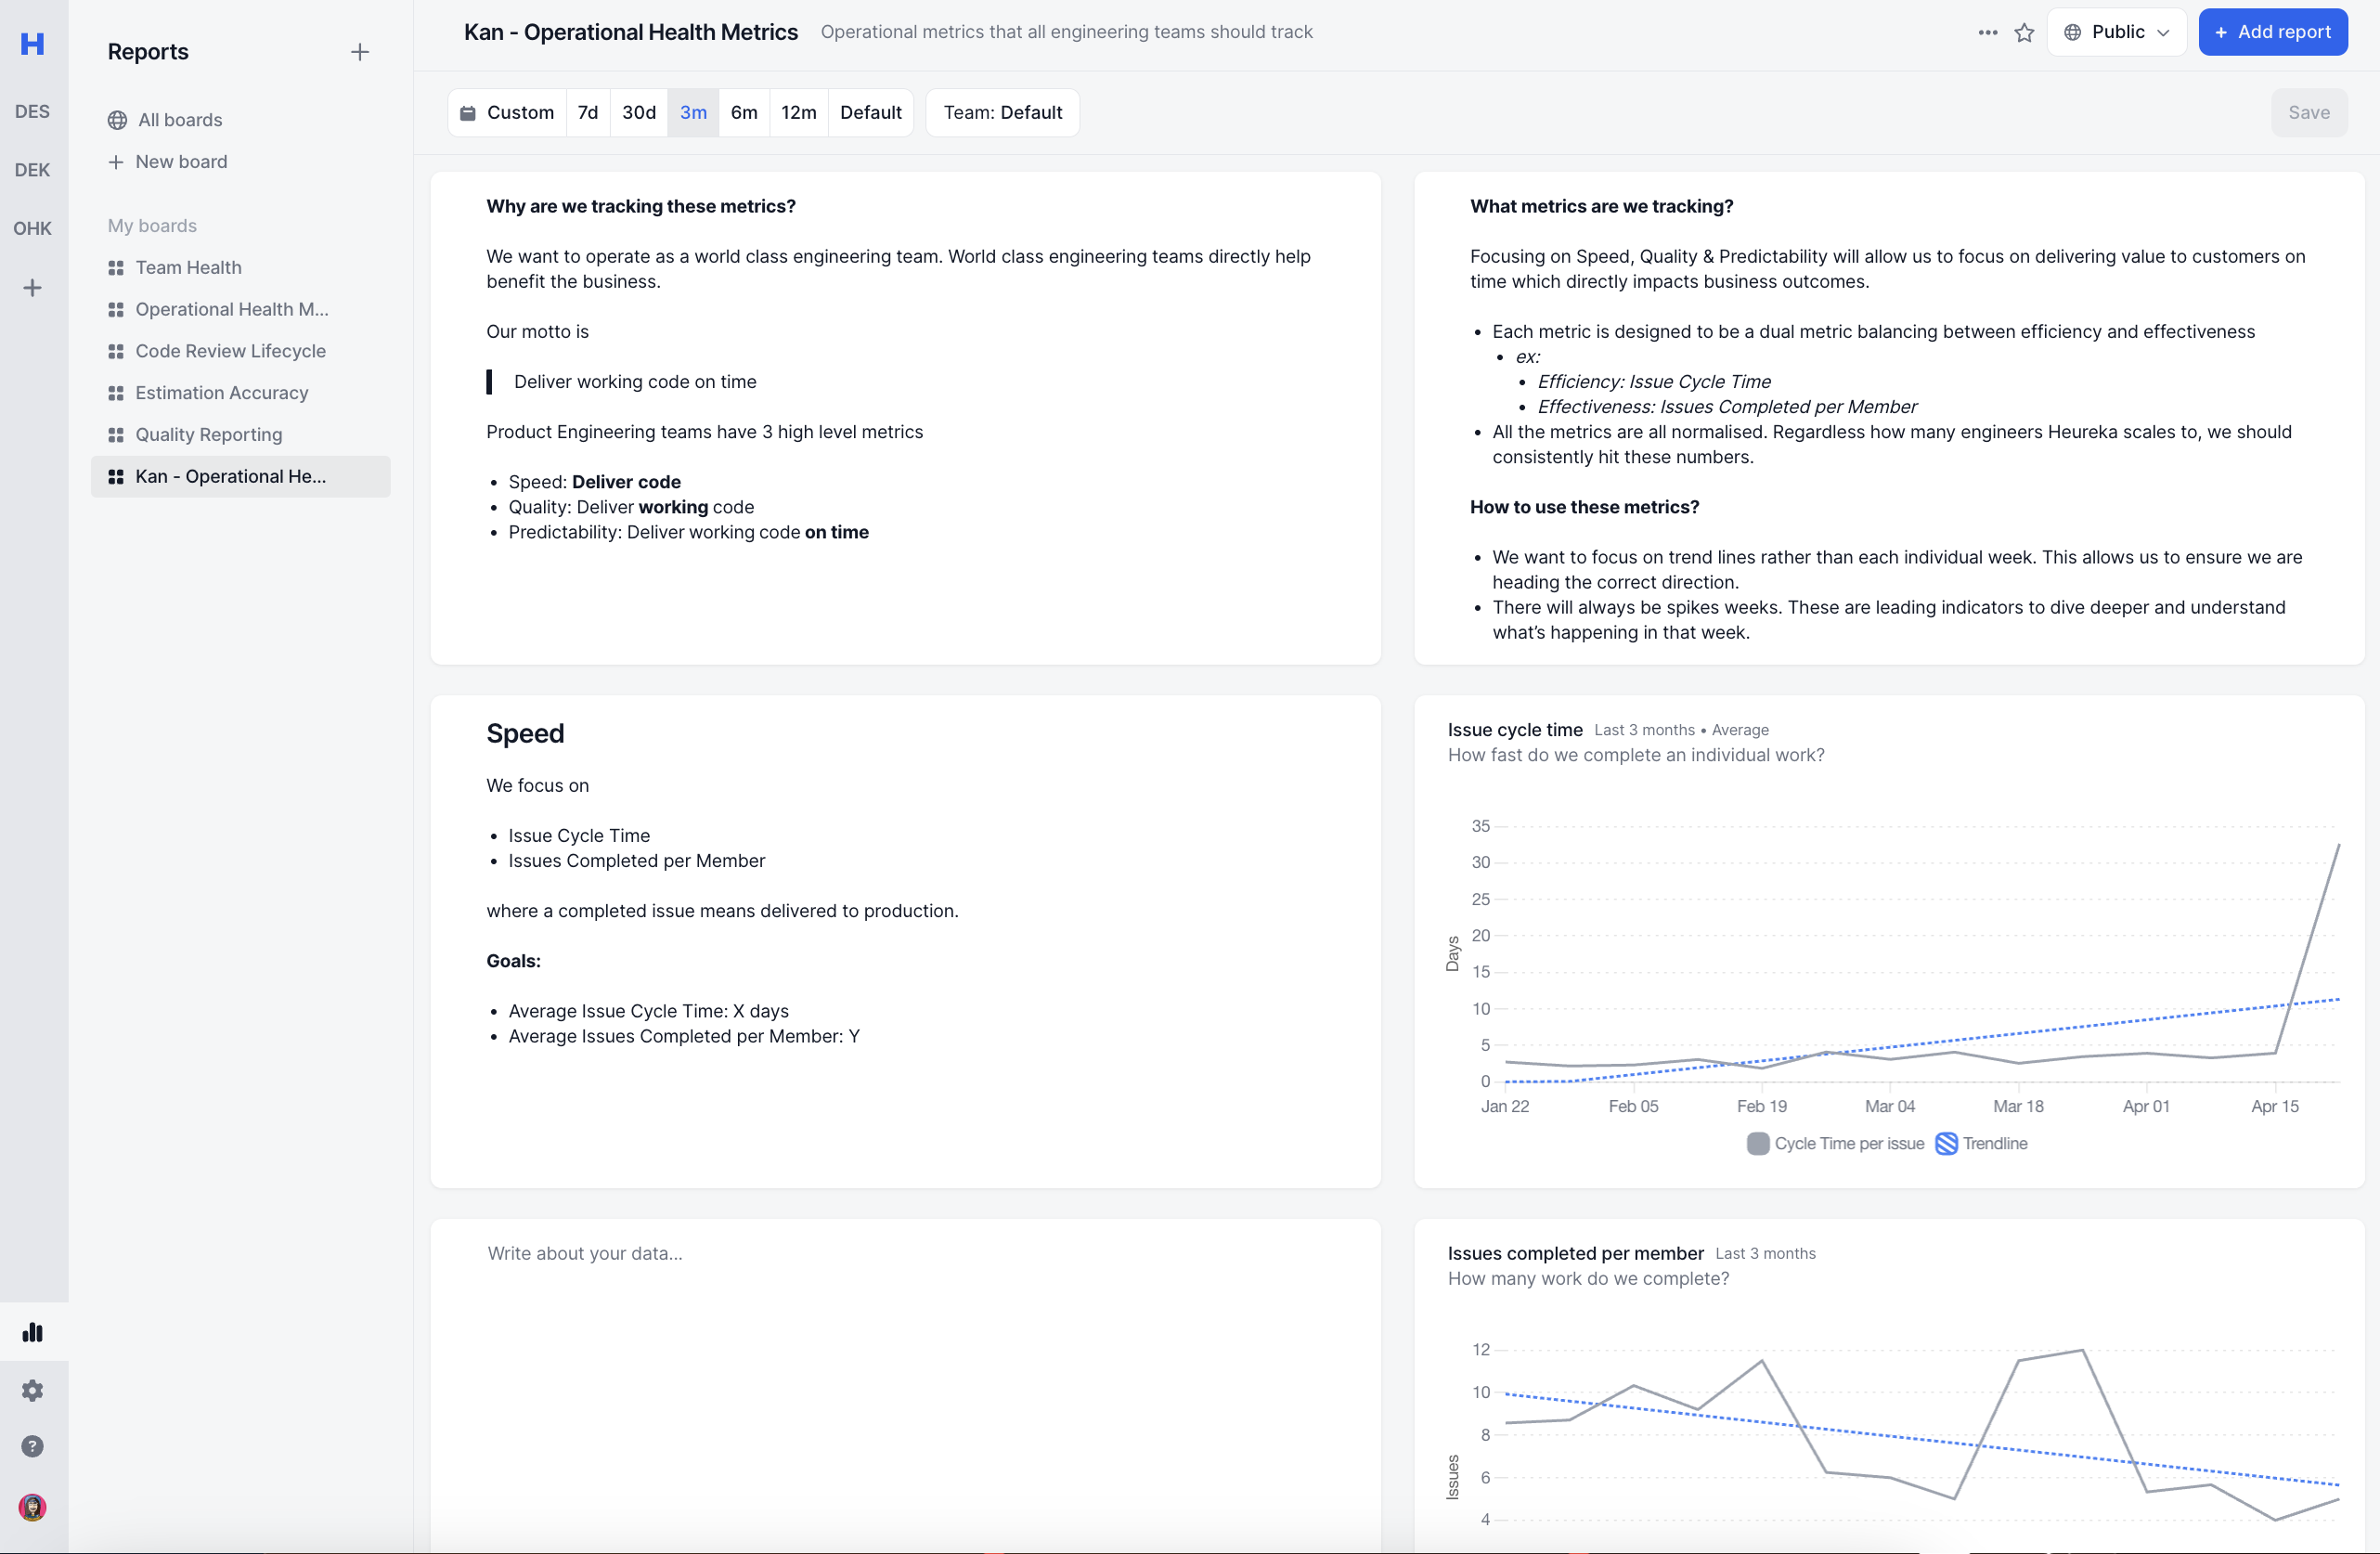
### Operational Health Metrics

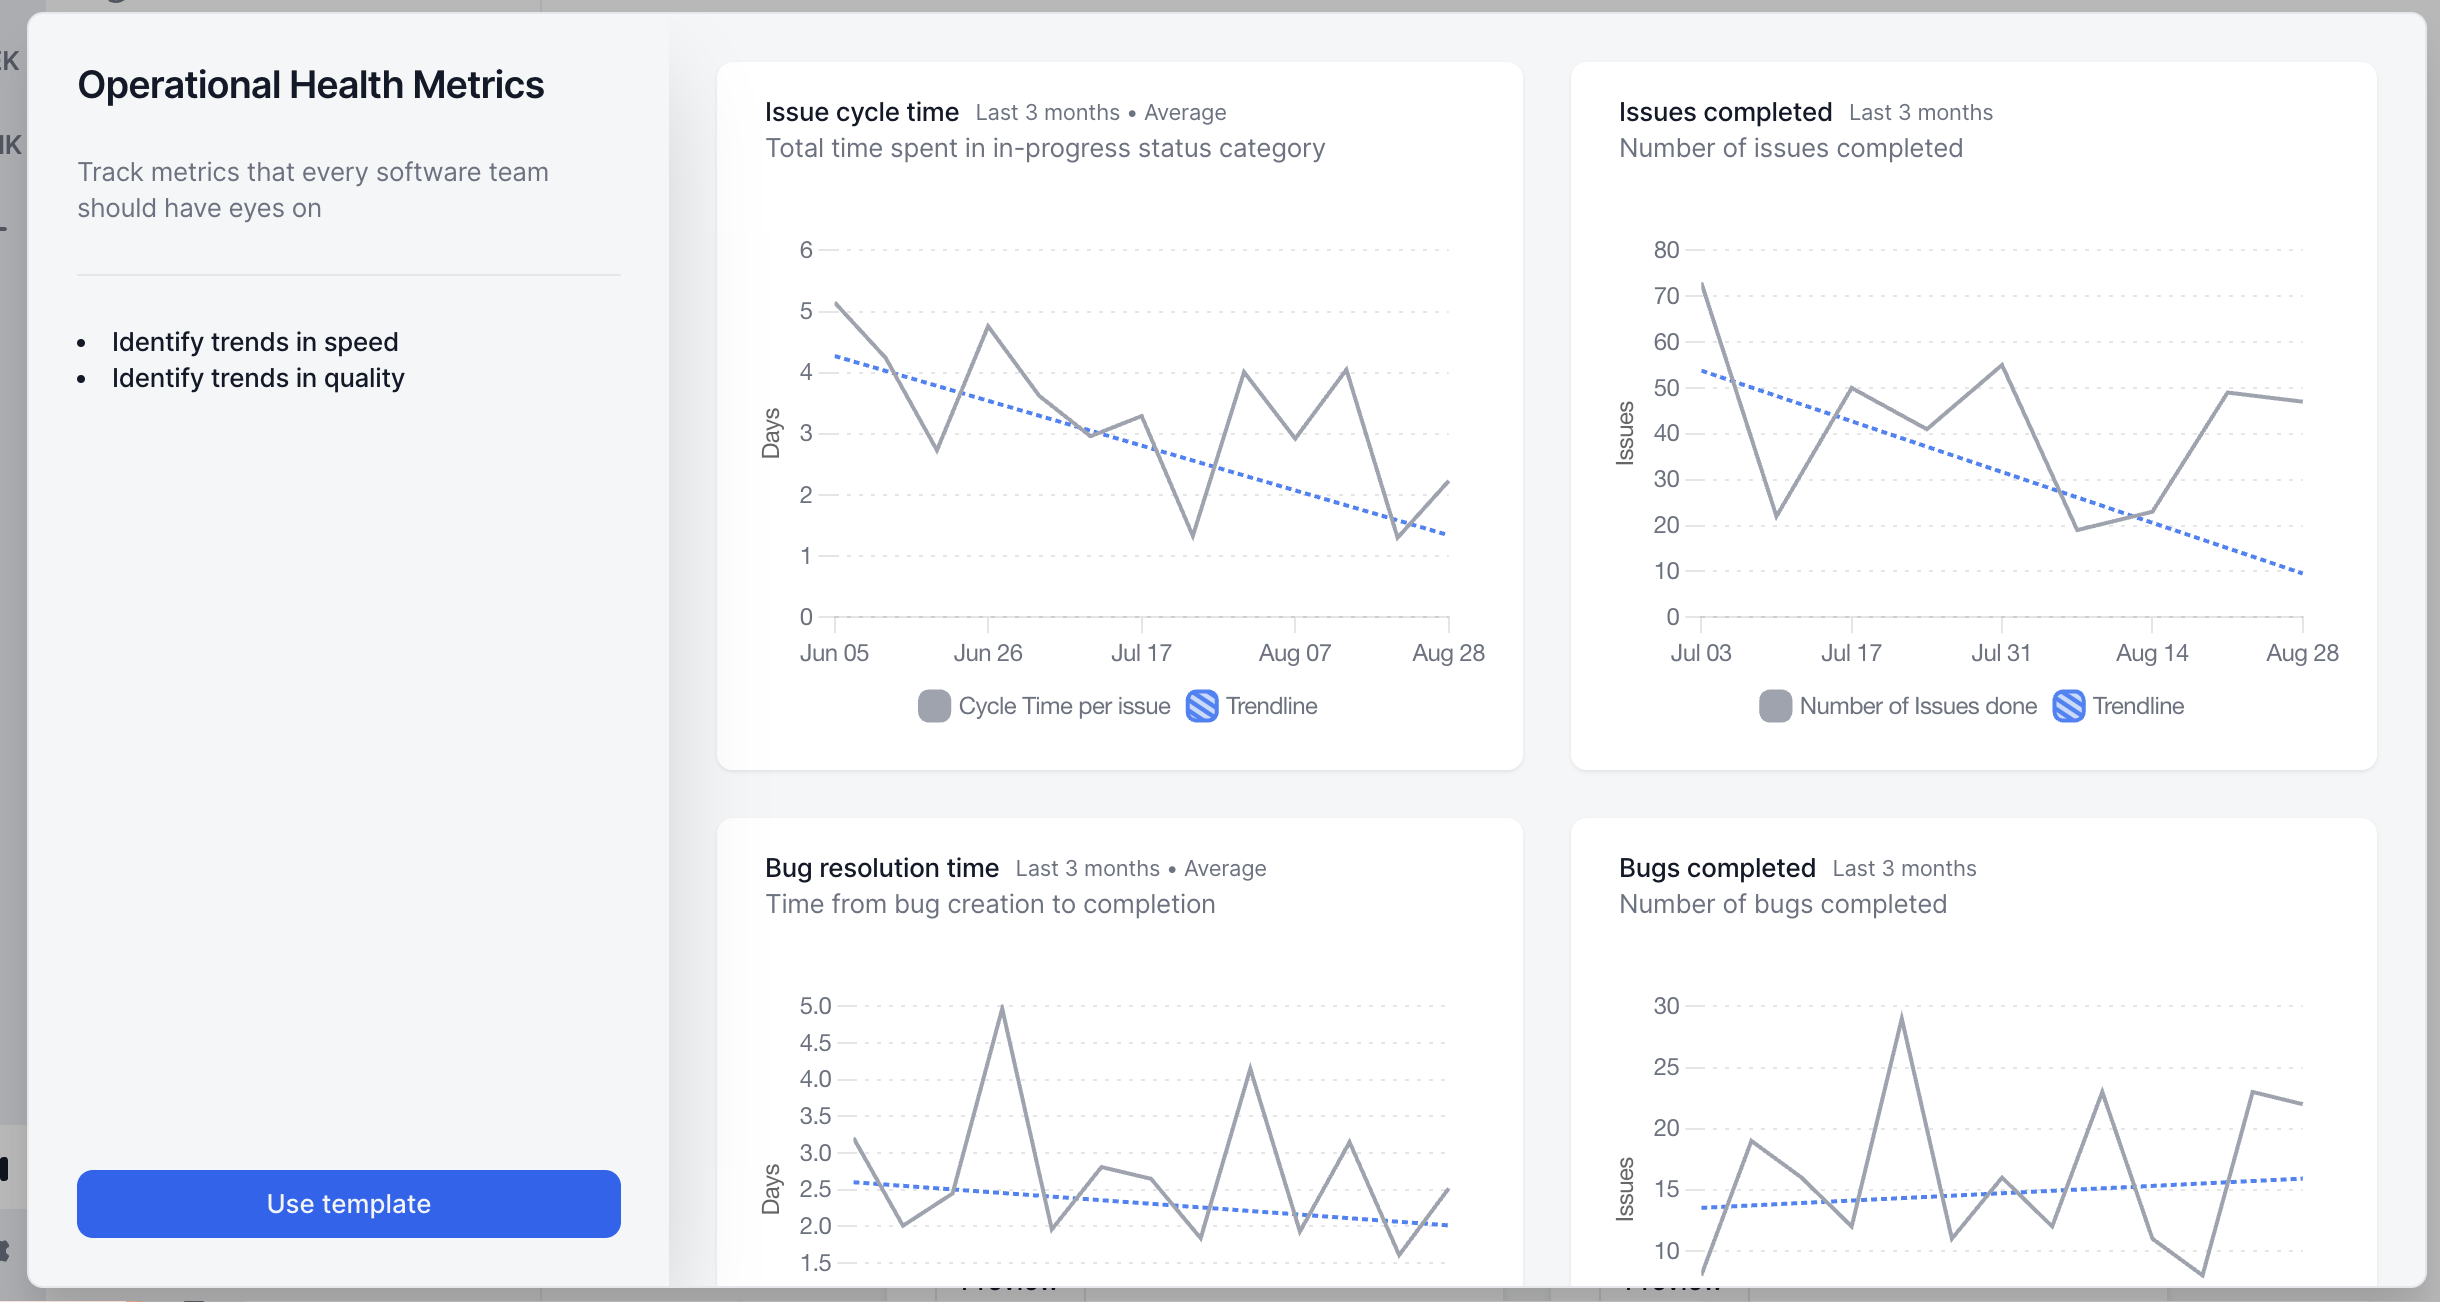
Operation health metrics are KPIs that are typically checked monthly.&#x20;

Learn how to select health metrics [First Principles of Engineering Metrics](/guides/first-principles-of-engineering-metrics)

<figure><img src="https://cdn.zappy.app/dfe406e56b631aac7ca1a70957e683e6.png" alt=""><figcaption></figcaption></figure>

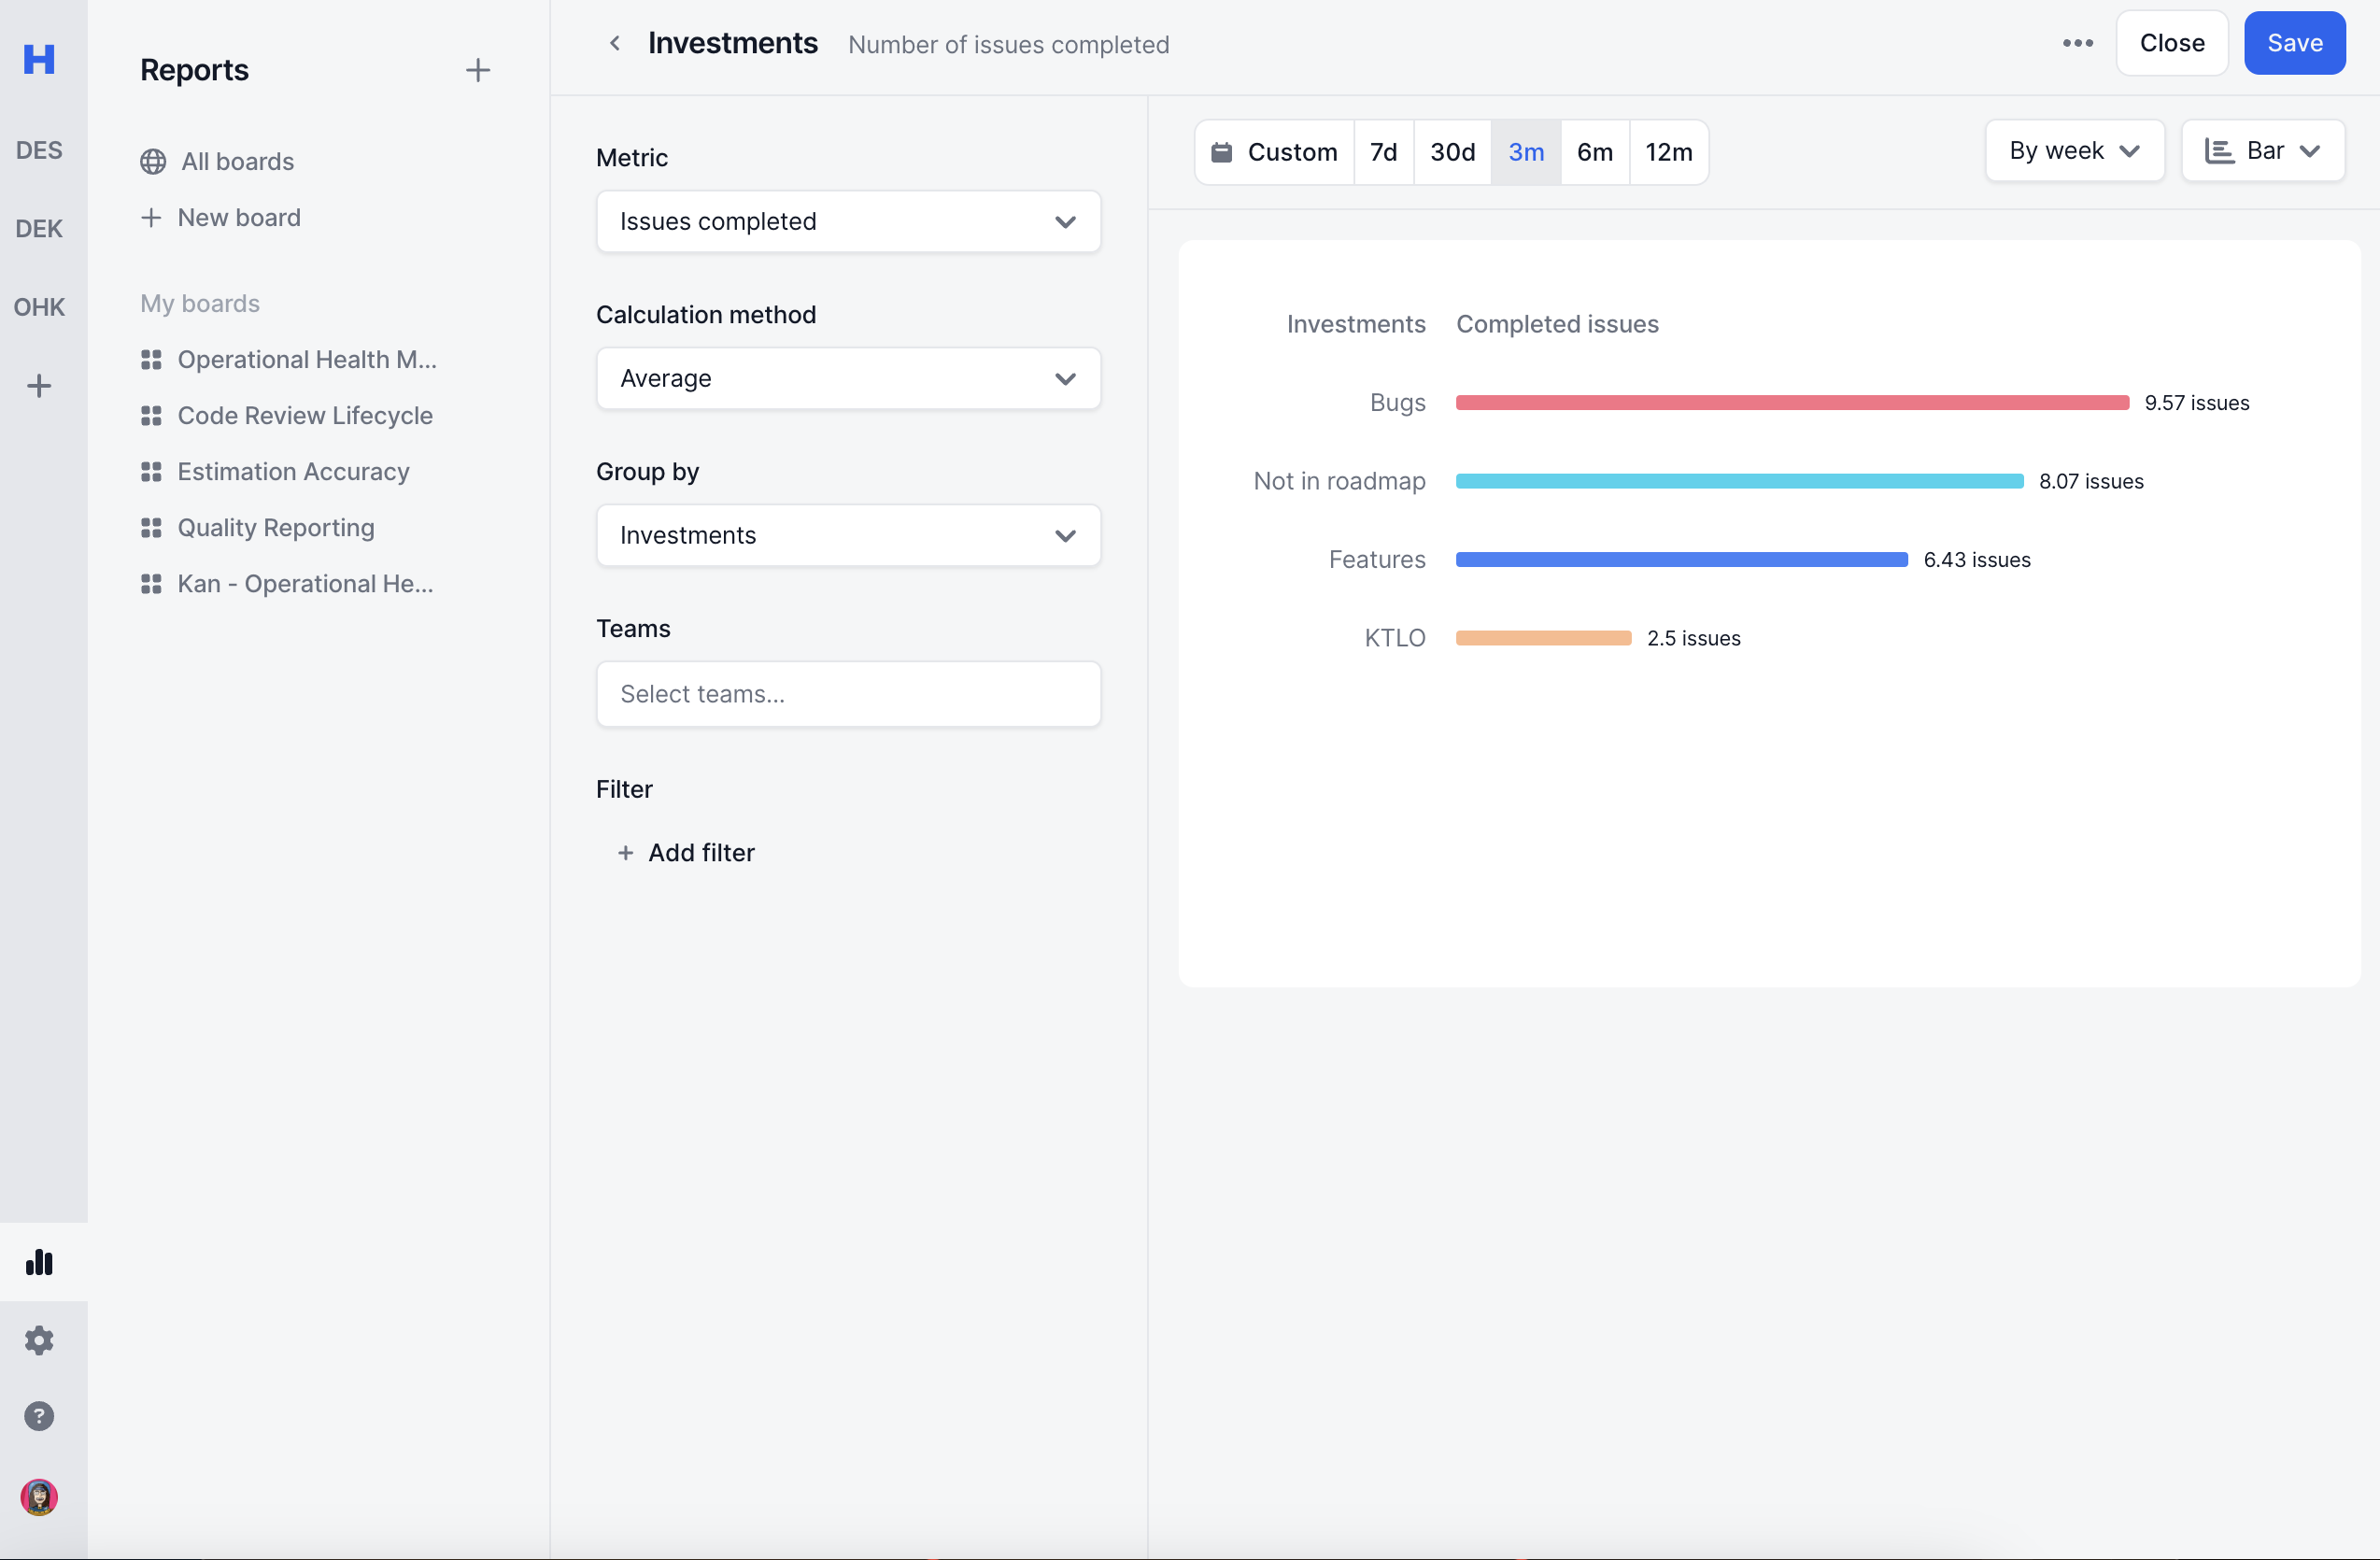
### Investments

Understand where spend our time.&#x20;

<figure><img src="https://cdn.zappy.app/a91475bc7e5272ff9ed3b61e790a5bf7.png" alt=""><figcaption></figcaption></figure>

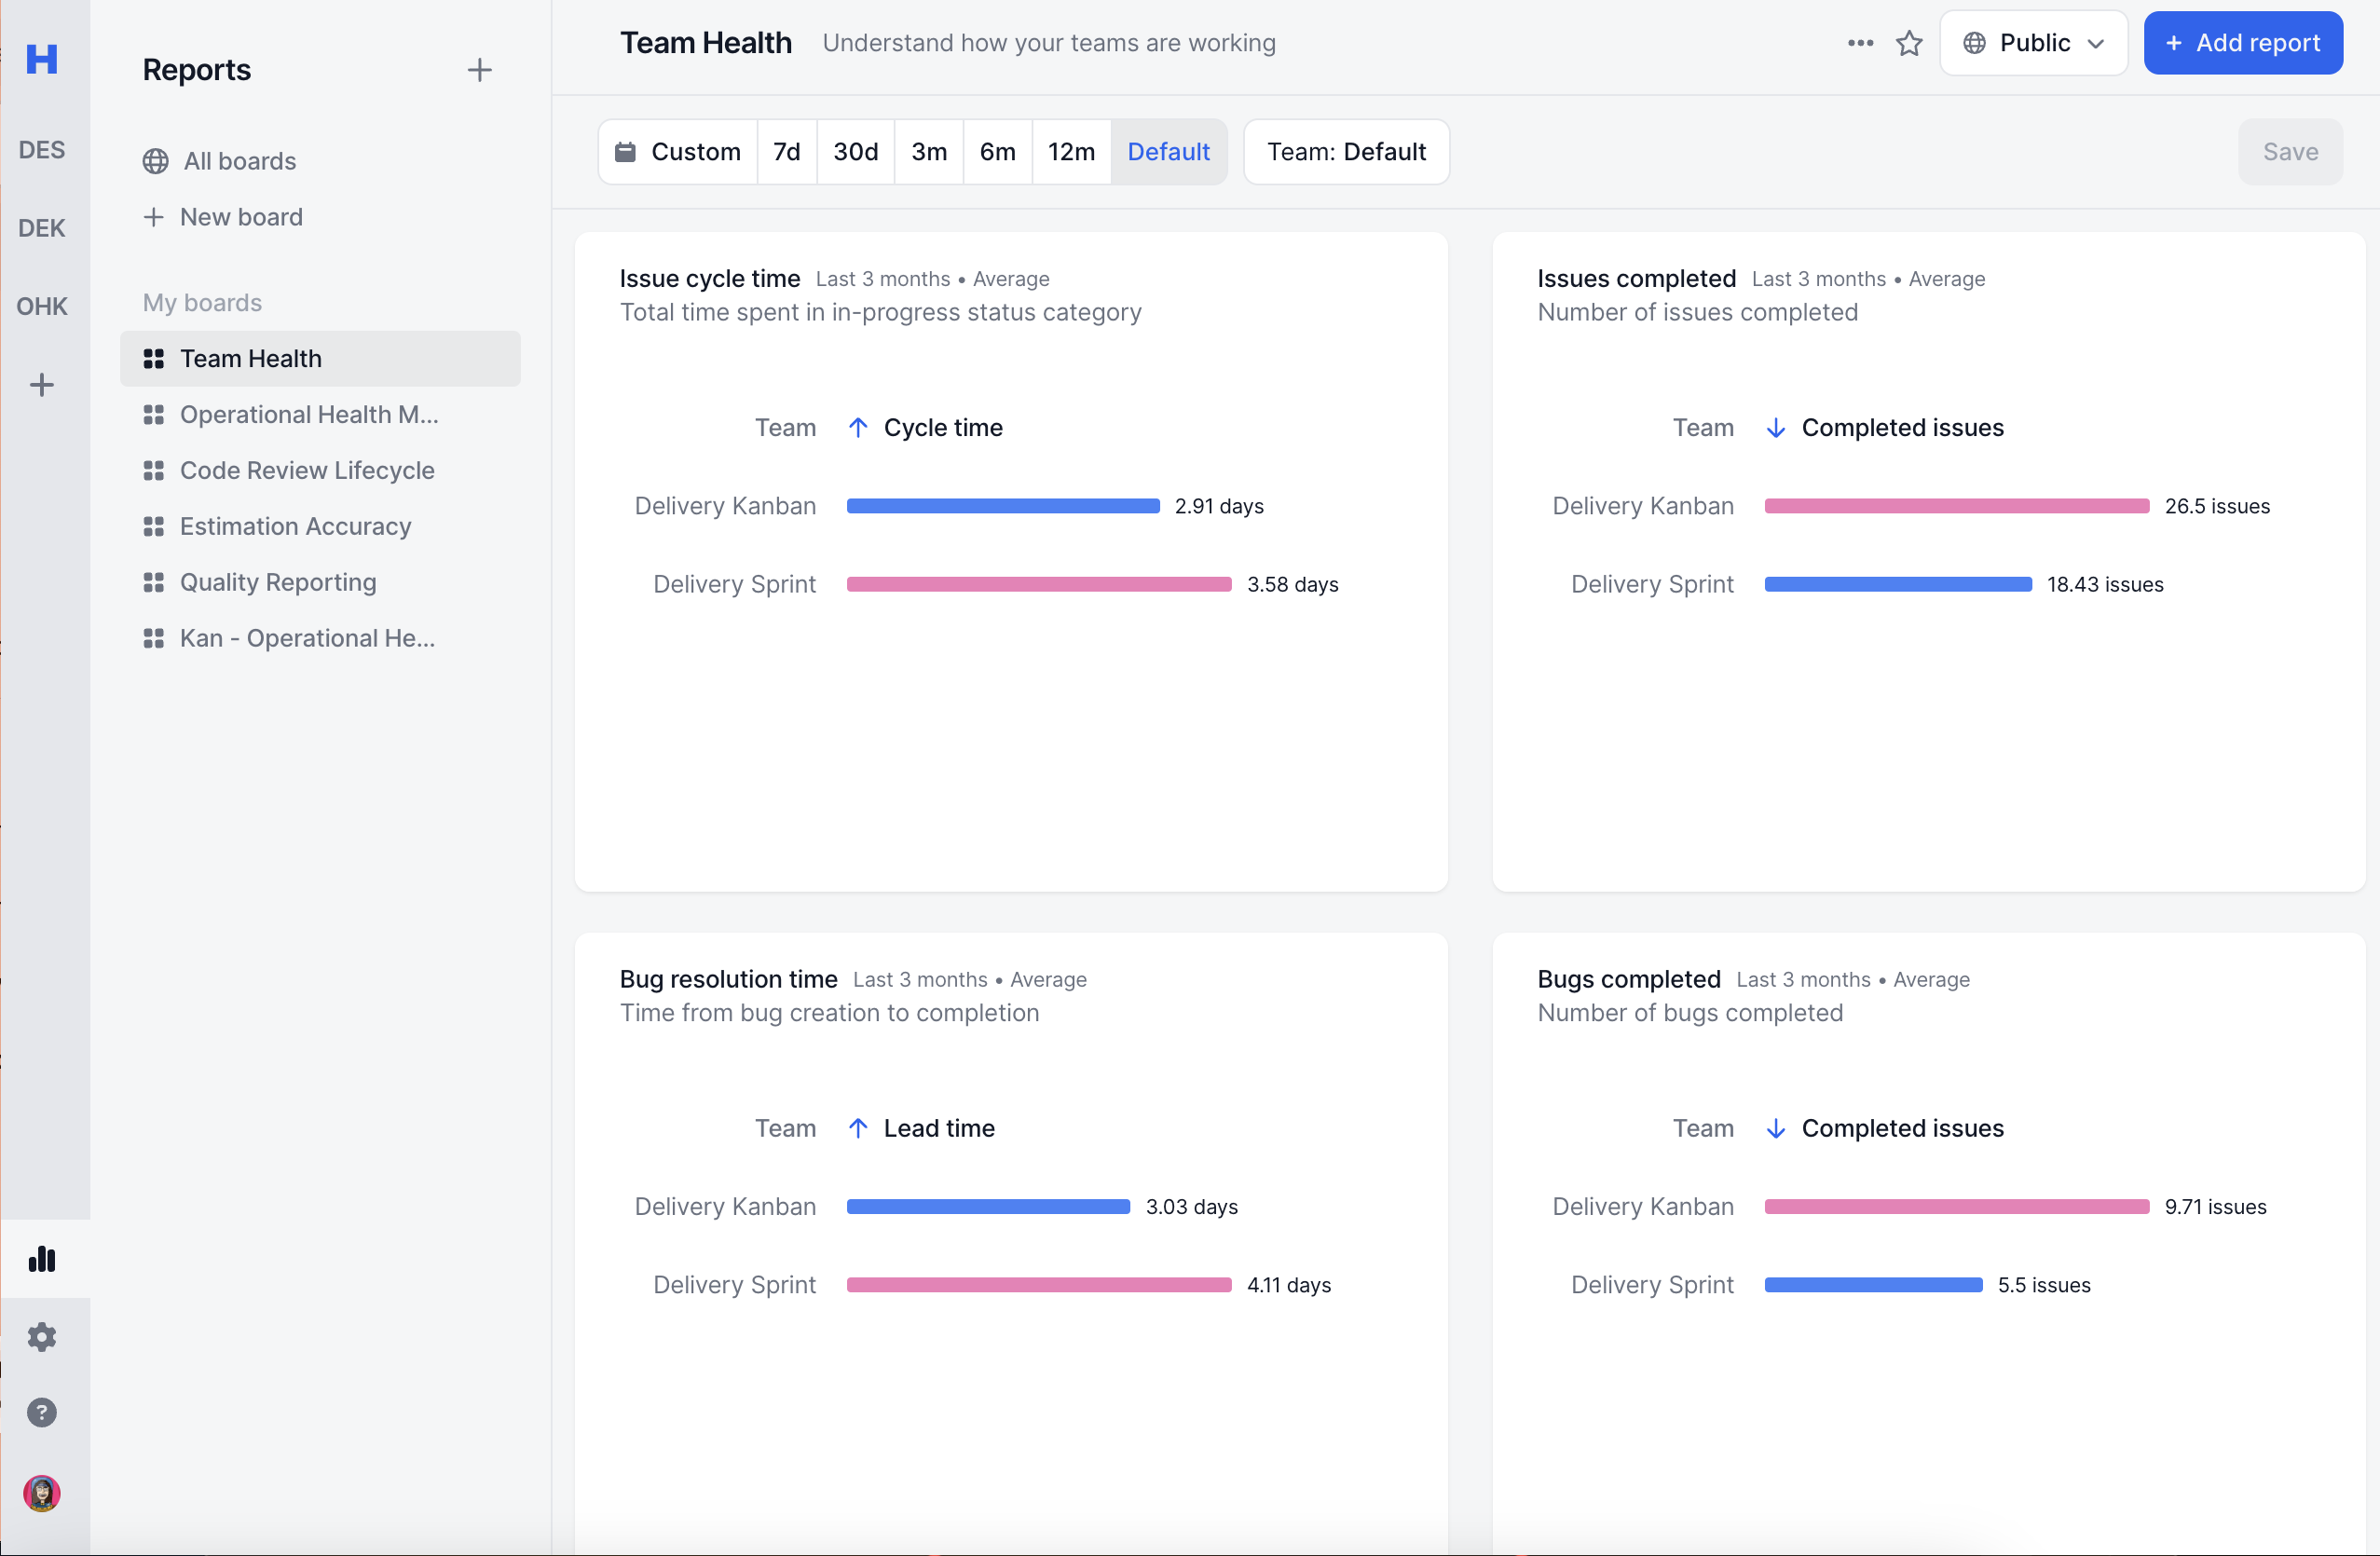
### Team Health

See across health metrics across different teams

<figure><img src="https://cdn.zappy.app/759397945cc568a730ffeee5ce250226.png" alt=""><figcaption></figcaption></figure>

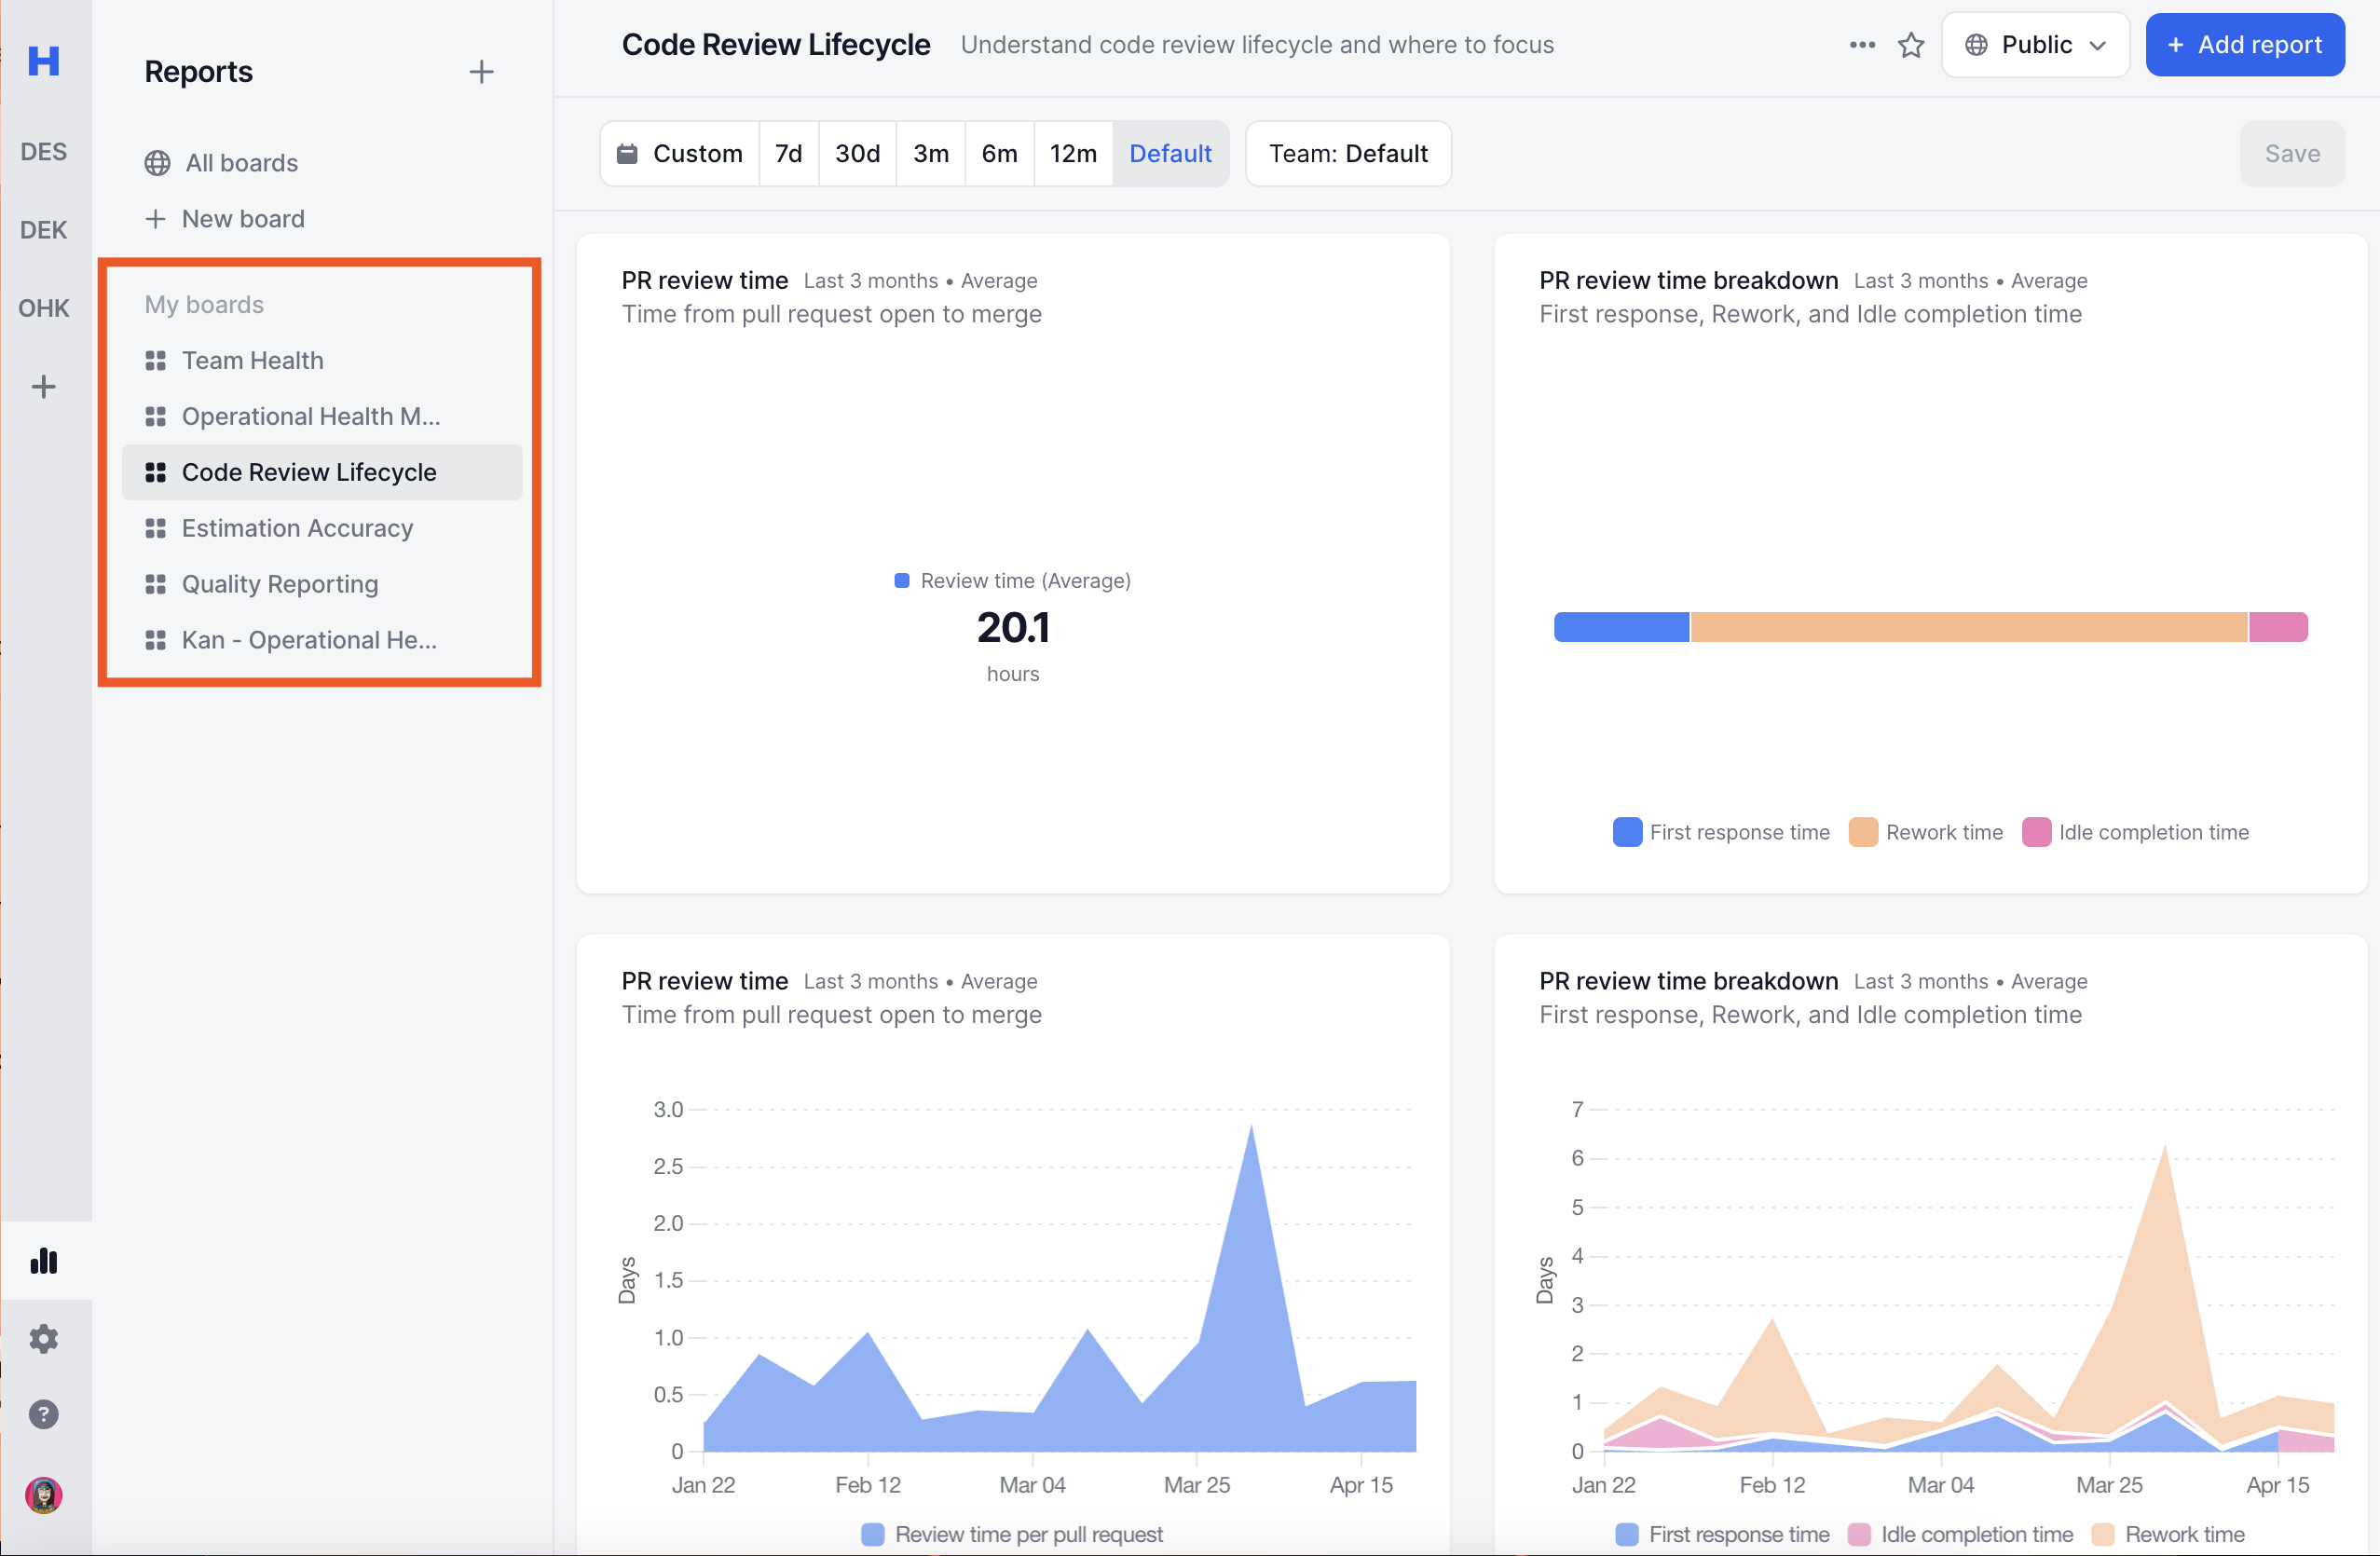
### Debugging Organization

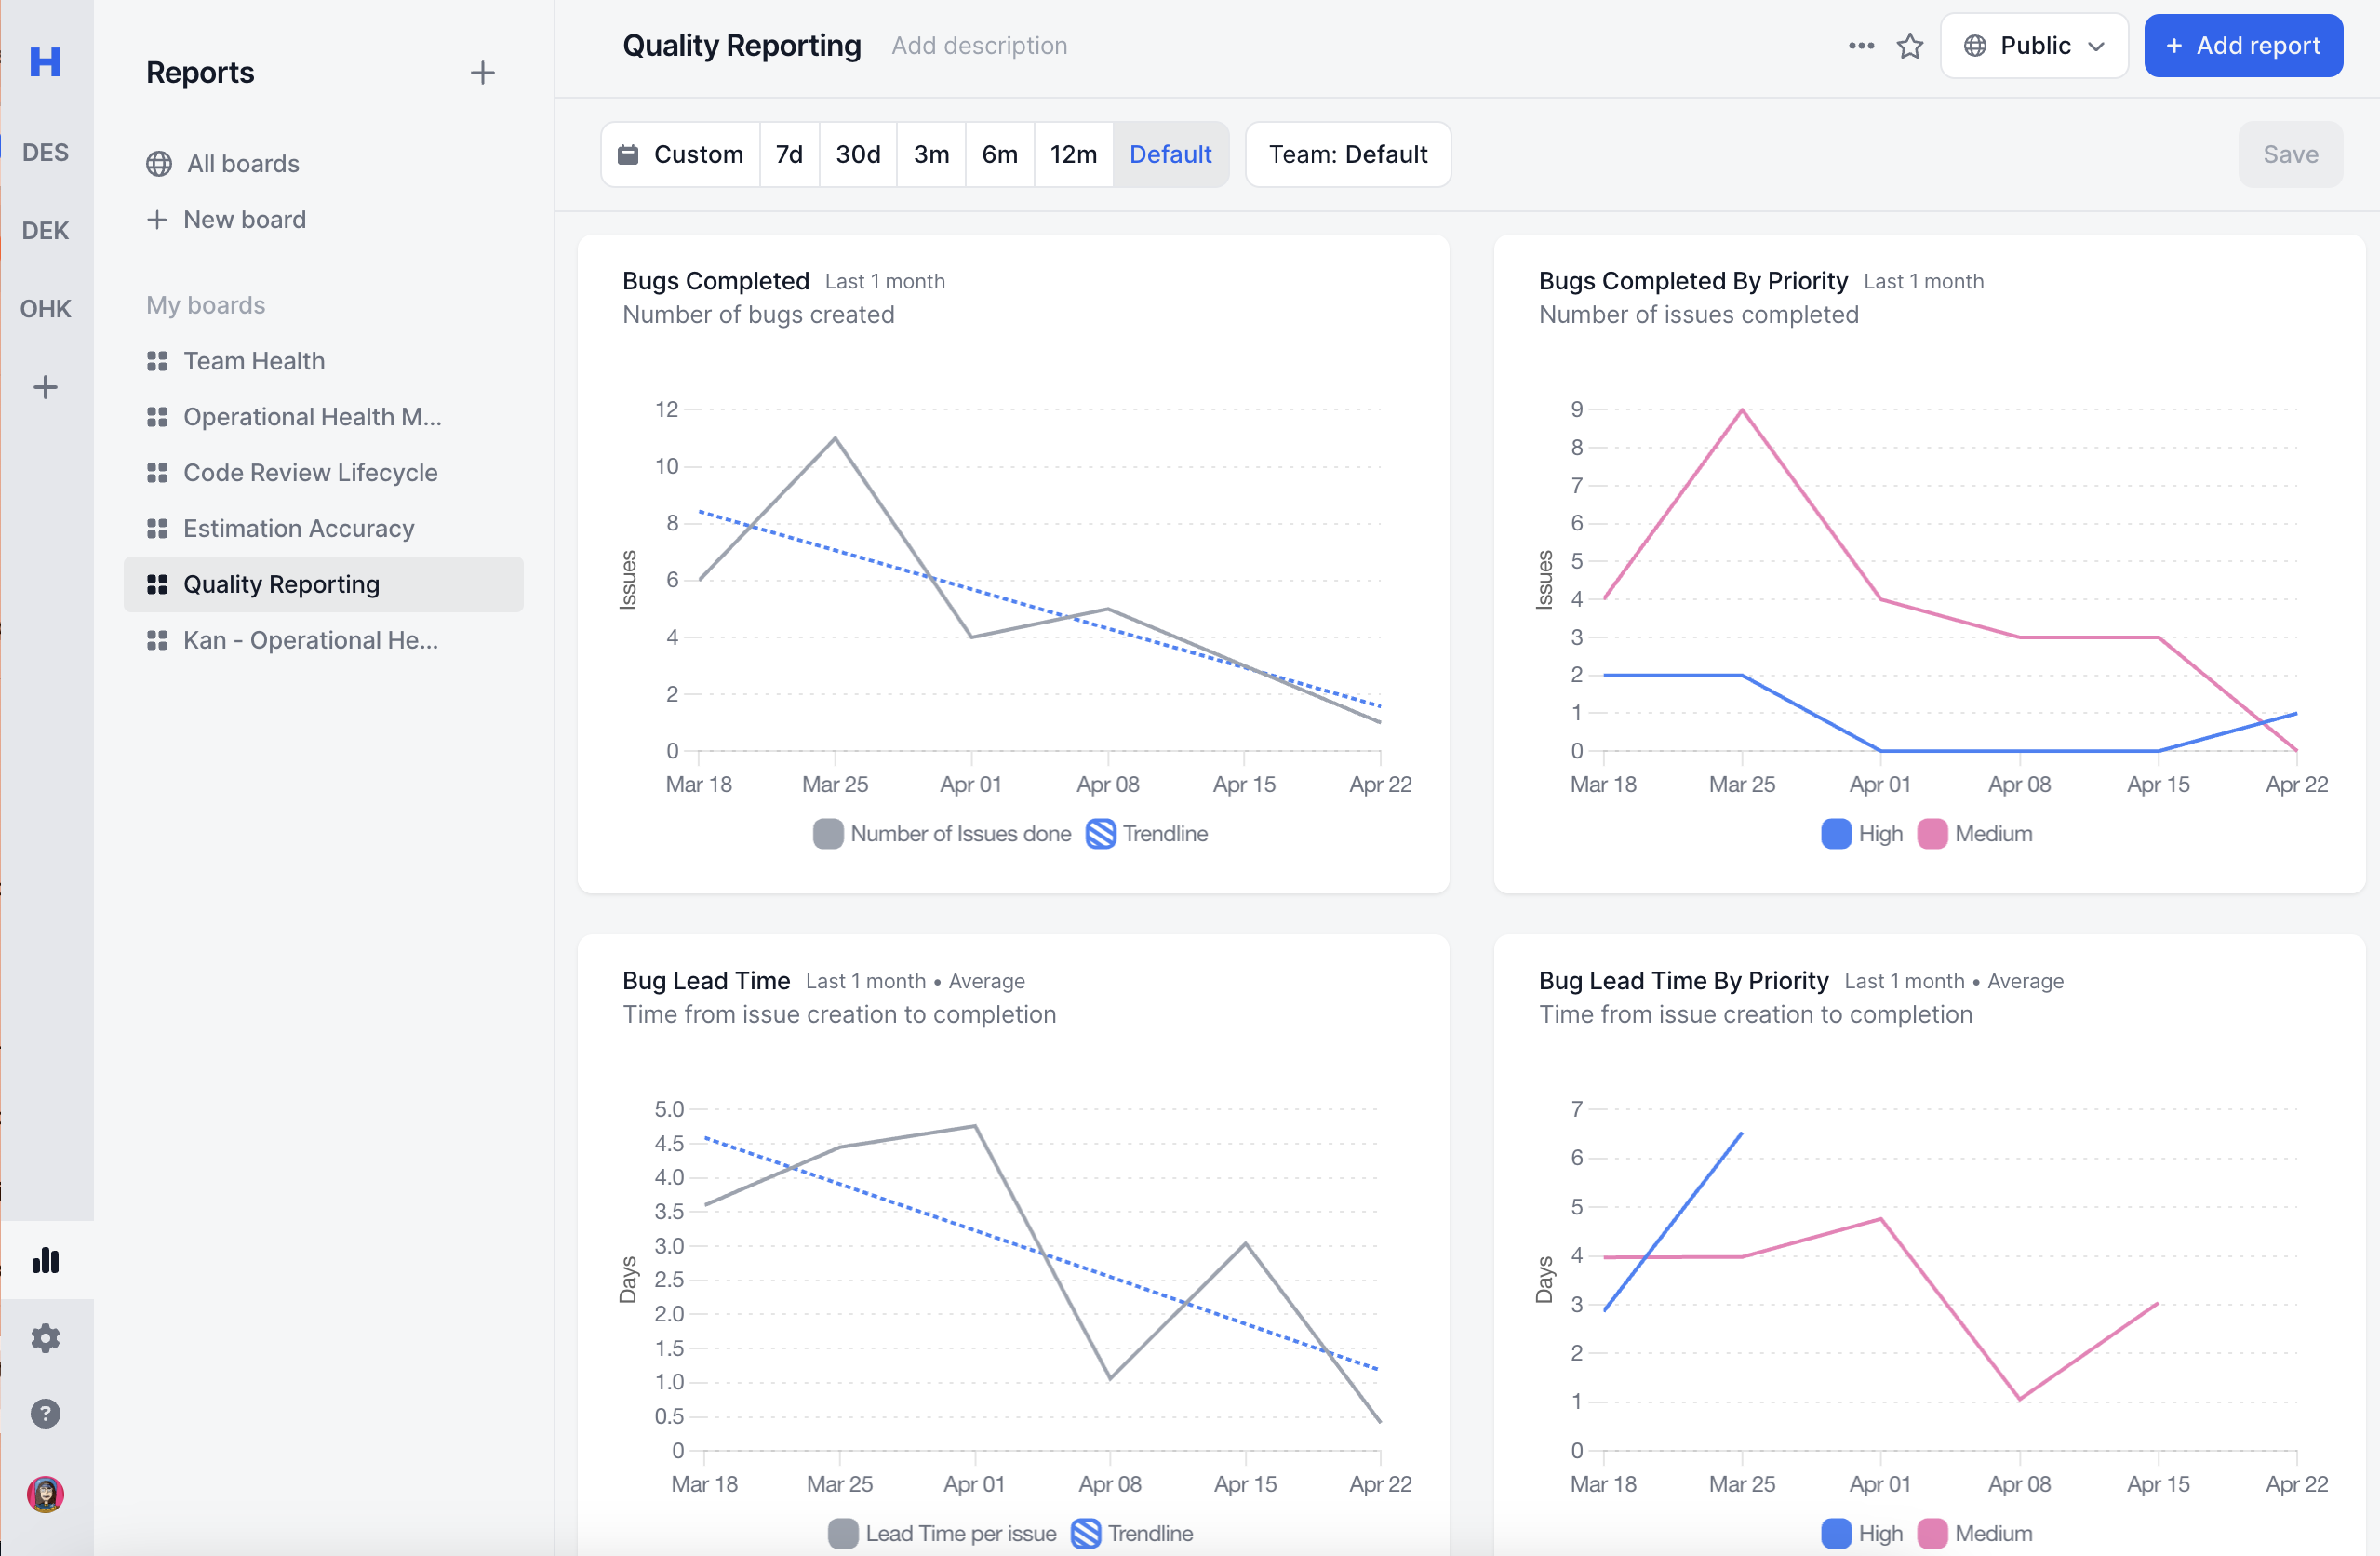
Create multiple boards each allowing you to debug one part of your organization from pull request health to bug dashboard.&#x20;

<figure><img src="https://cdn.zappy.app/809b399c7249559621d1b6f2b1407d05.png" alt=""><figcaption></figcaption></figure>


# For Managers

### Create your first team

Haystack has it's own abstraction of teams. You can create a new team from the plus button in the sidebar

Learn how to create your [first team](/setup/teams).

<figure><img src="https://cdn.zappy.app/4b8eceb53f9f3c4aefc6b906d5ca711a.png" alt=""><figcaption></figcaption></figure>

## Use cases

### Delivery Commitments

#### [Last 24 hours](/features/issues#h_8439a26fcd)

Improve your standup efficient. Get status updates in 10 second

<figure><img src="/files/HJIVf6HRVdq7gXVlsNLG" alt=""><figcaption></figcaption></figure>

This view allows your to see all activity changes across Git & Jira for any issue.

<figure><img src="/files/RyhMztrQlDr0HtTXncB7" alt=""><figcaption></figcaption></figure>

#### [Risk & SLA Alerts](/features/alerts)

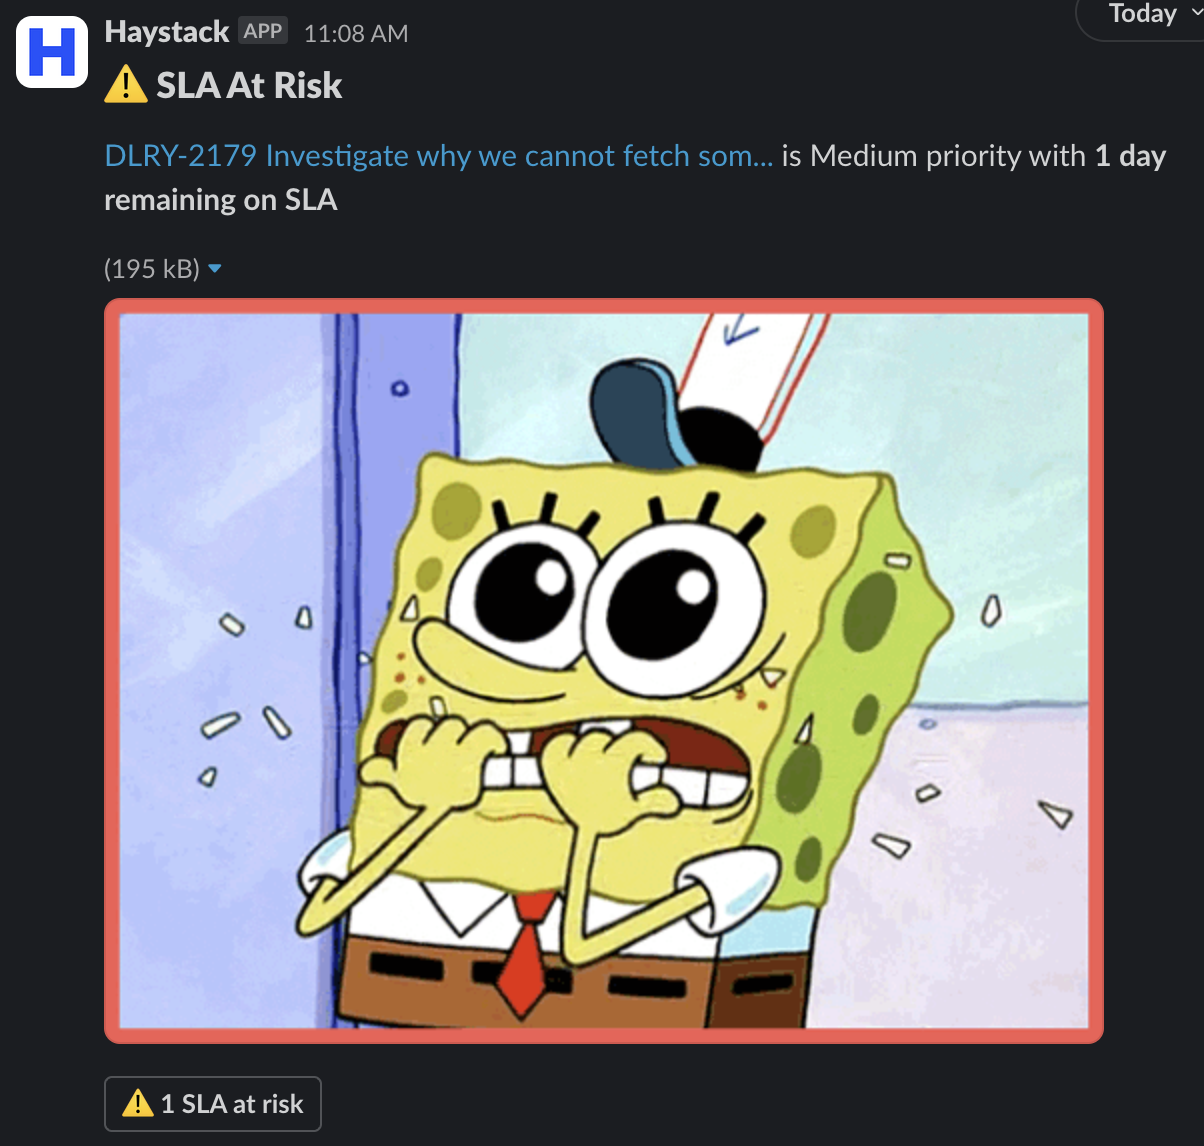
You can set create risks & Bug SLAs then create alerts on them.&#x20;

<figure><img src="https://cdn.zappy.app/aab2ac5b5fb78c943c3c917e91569757.png" alt=""><figcaption></figcaption></figure>

### Reporting

#### [Retrospectives](/features/retrospective)

Complete view of your sprint, and why you missed your goals.

<figure><img src="/files/LY8pIUVQsQld2n2PgTDb" alt=""><figcaption></figcaption></figure>

#### [Metrics](/features/flexible-reports)

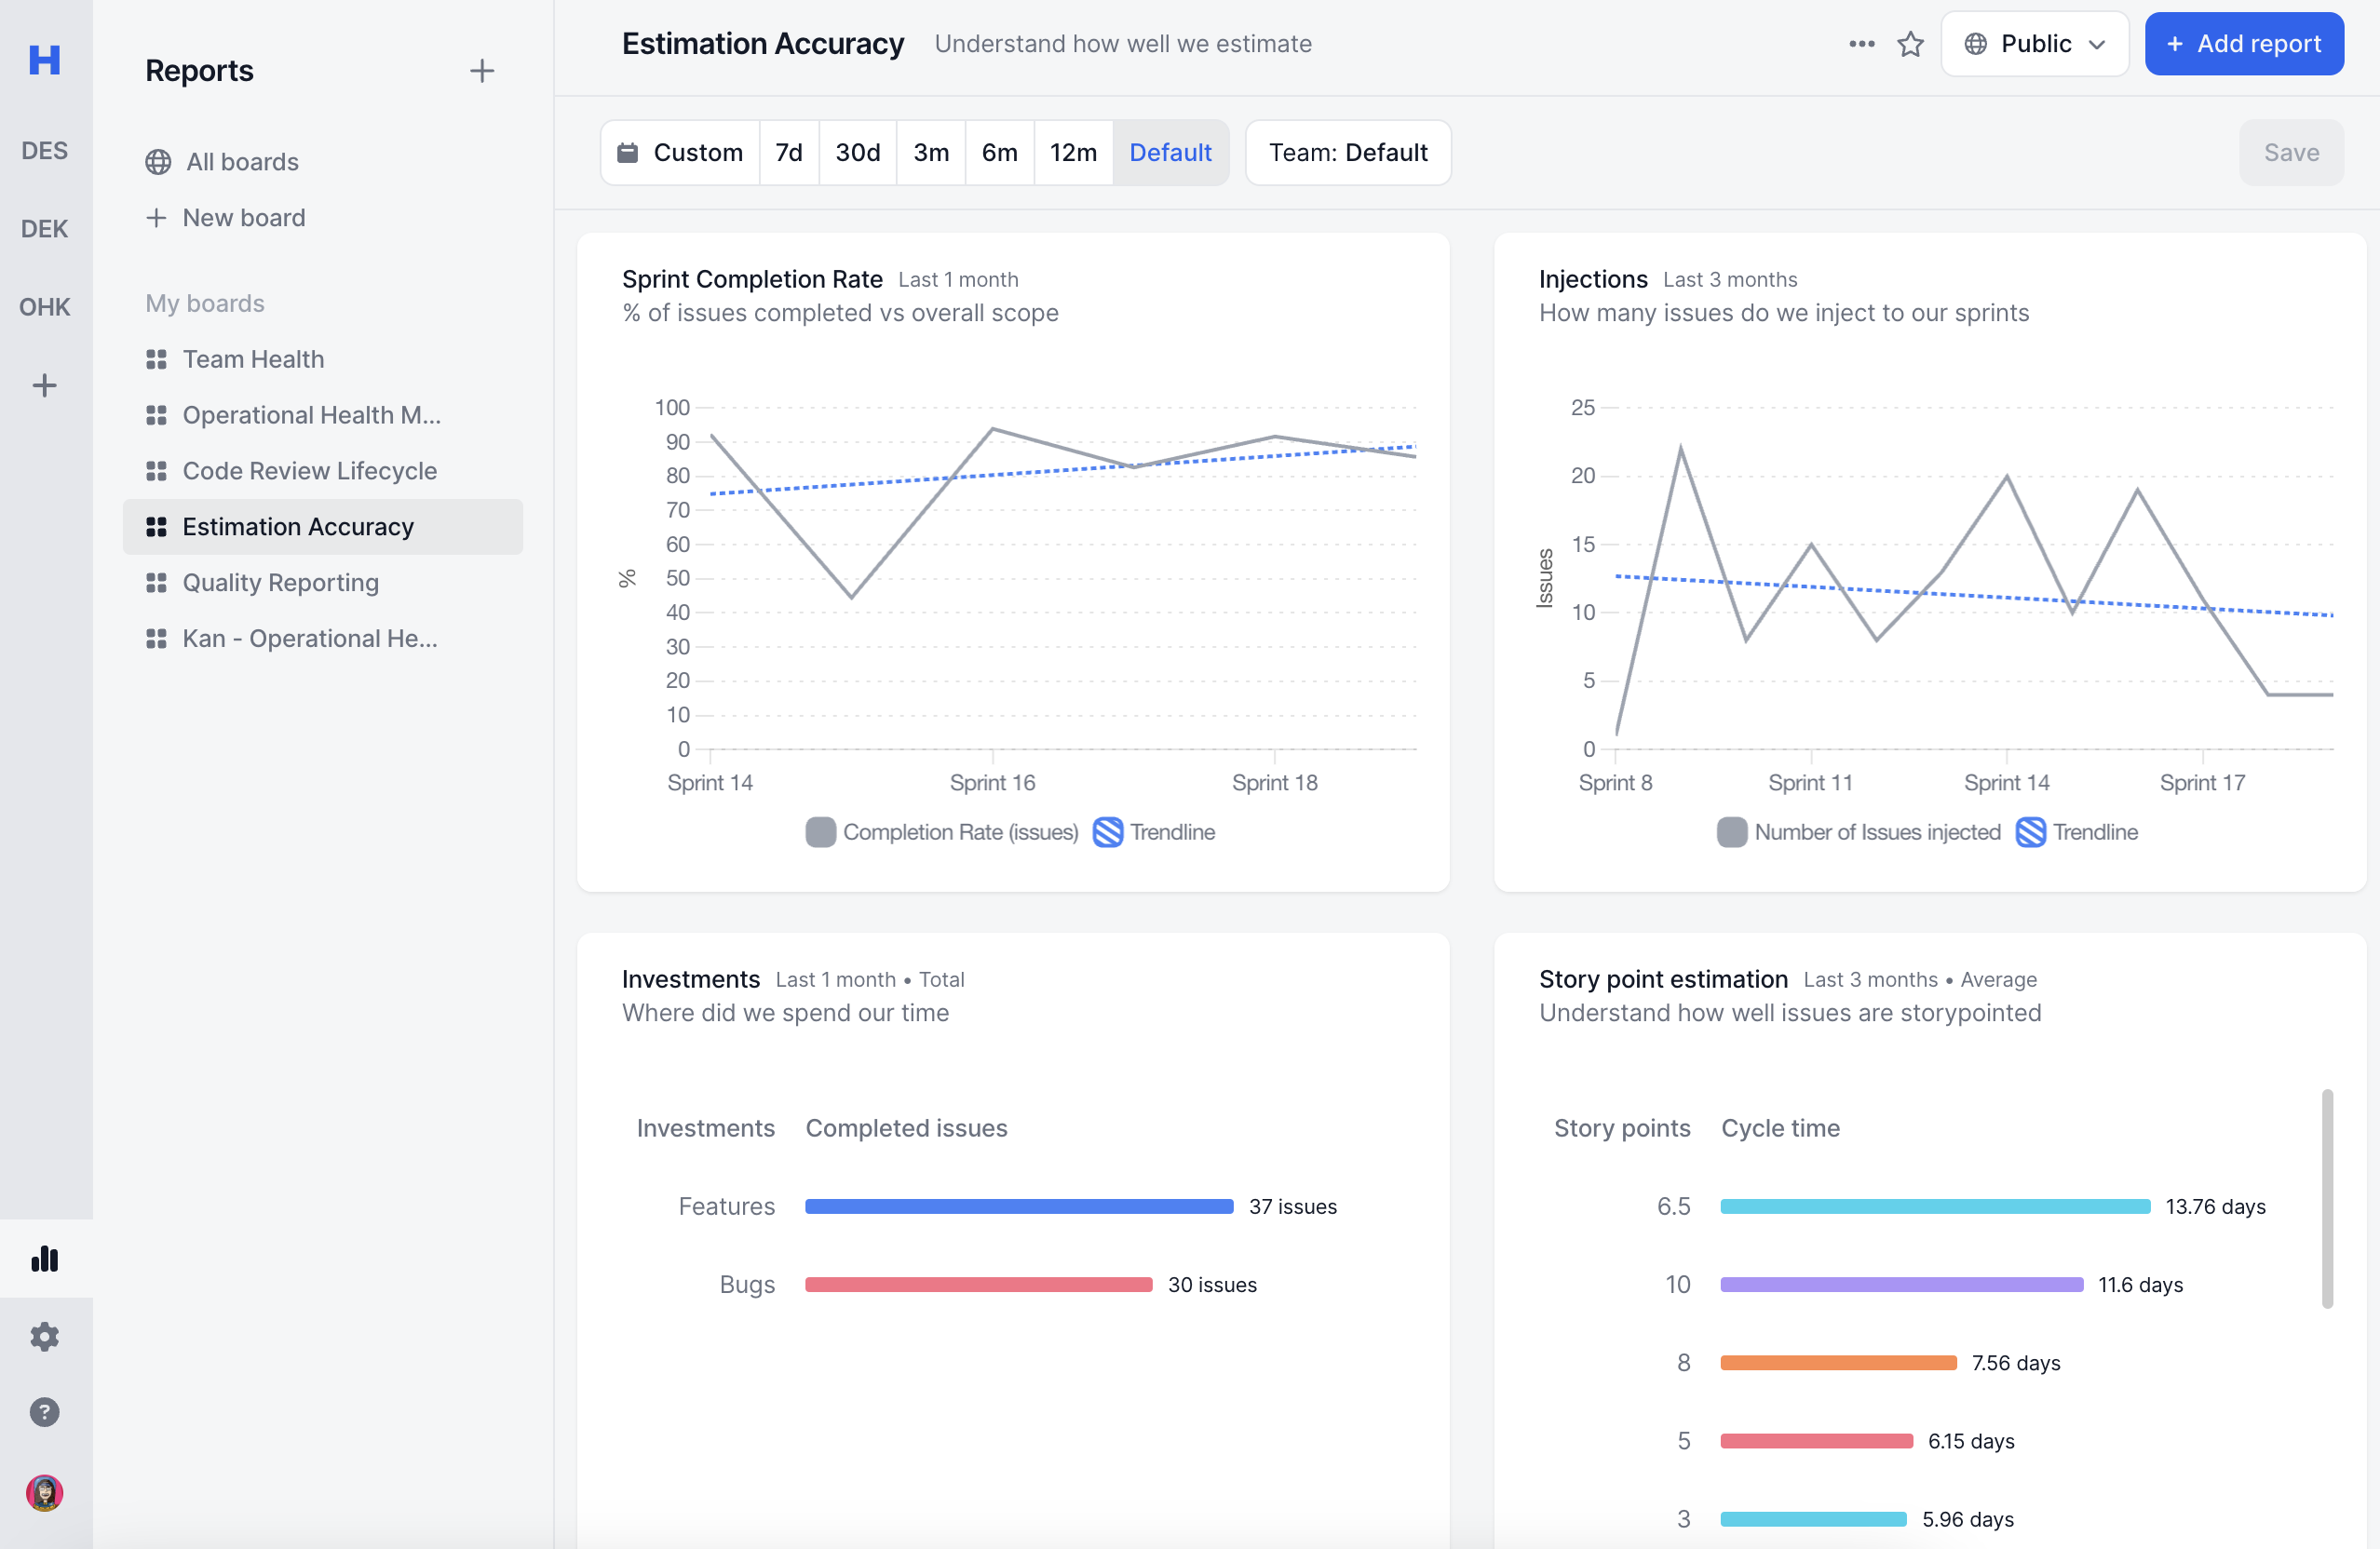
Create your own boards from metrics across JIRA & Github

<figure><img src="/files/REoaTlY21FbqAnSpsJVP" alt=""><figcaption></figcaption></figure>

### Update Stakeholders

#### [Release Notes](#release-notes)

Streamline communication with outside your teams.&#x20;

<figure><img src="/files/d5ElvZN9Jb8jG9g0qIIb" alt=""><figcaption></figcaption></figure>


# For Product

### Subscribe to your team

You can join any team created by other users from the plus button in the sidebar.&#x20;

Learn how to subscribe to your [first team](/setup/teams).

<figure><img src="https://cdn.zappy.app/4b8eceb53f9f3c4aefc6b906d5ca711a.png" alt=""><figcaption></figcaption></figure>

## Use cases

### Track Progress

#### [Release Notes](/features/release-notes)

Understand what your team has released by AI generated release notes.&#x20;

<figure><img src="/files/d5ElvZN9Jb8jG9g0qIIb" alt=""><figcaption></figcaption></figure>

#### [Epic Progress](/features/epics)

Prevent last minute roadmap delays by understanding how each epic is progressing over time.

<figure><img src="/files/MhfMoDmarzd6K5zk3bsU" alt=""><figcaption></figcaption></figure>

### Plan Ahead

#### [Investments](/features/investments)

Understand where your team is spending their time by checking % of work that is directed towards roadmap items vs bugs & technical debt.&#x20;

<figure><img src="/files/HP7vhdPSCLzXxgdL9pLR" alt=""><figcaption></figcaption></figure>


# Integrations

Haystack integrates with the following integrations

* [JIRA](/setup/integrations/jira)
* [GitHub Cloud](/setup/integrations/github-cloud)
* [GitHub Enterprise](/setup/integrations/github-enterprise)
* [Gitlab](/setup/integrations/gitlab)
* [Bitbucket](/setup/integrations/bitbucket)
* [Slack](/setup/integrations/slack)


# Jira

Connect Jira to see all your work in a single place and identify trends, risks, blockers and many more.

## Basics

Haystack utilizes Jira data to gather information about your past and active work. Historical data is used to generate metrics and reports, while active work is analyzed to inform you about the current state of your delivery.

## Configure

{% tabs %}
{% tab title="Update integration" %}
{% hint style="info" %}
Default token would give a sync time of 30 minutes.

To improve the sync time to 10 seconds check [Real Time Data Sync](broken://pages/AFrpWnNzXLWNlfYFY9ca) doc.
{% endhint %}

1. Go to [Org settings -> Integrations -> Jira](https://delivery.usehaystack.io/integrations/jira).
2. Click on menu icon and choose `Update`:

   <figure><img src="/files/pSiGgJN2jG0va5LEFd8a" alt=""><figcaption></figcaption></figure>
3. Fill in requested fields:
   1. **API token:** go to [API Tokens page](https://id.atlassian.com/manage-profile/security/api-tokens) in Jira. Select from existing API tokens or create a new one. Make sure that token you create is not expired.
   2. **Email:** Use the email associated with your Jira account where the token was generated.
   3. **Jira Base URL:** You can find the Jira base URL in your browser's address bar

      <figure><img src="/files/WuGXDh18YL6tBahkJyWS" alt=""><figcaption><p><strong>Jira Base URL</strong></p></figcaption></figure>
4. Click `Connect`.
5. Wait for the data to sync. This usually takes about 1 hour, but can extend up to 6 hours depending on the organization size.
   {% endtab %}
   {% endtabs %}

## Permissions

List of data that is stored at Haystack:

<table><thead><tr><th width="175">Category</th><th>Data stored</th></tr></thead><tbody><tr><td>System</td><td>Issue statuses, priority types, column types, etc.</td></tr><tr><td>Issues</td><td>Title, content, create/update date, assignee, creator, reporter, custom fields (e.g., story points, sprints), etc.</td></tr><tr><td>Issue history</td><td>Title changes, assignee changes, etc.</td></tr><tr><td>Issue comments</td><td>Content, author info, etc.</td></tr><tr><td>Projects</td><td>Project name, type, key, issue types, etc.</td></tr><tr><td>Sprints</td><td>Start/end dates, title, state, etc.</td></tr><tr><td>Boards</td><td>Board JQL, title, column metadata, etc.</td></tr><tr><td>Members</td><td>Name, account ID, email, etc.</td></tr></tbody></table>

## FAQ

<details>

<summary>Why is my Jira Project or Board is missing?</summary>

This is likely due to limited access in your JIRA integration. To fix this, update your JIRA Integration token by following the steps below!

* Access Integration Settings
  * Visit: [Haystack JIRA Integration Page](https://dash.usehaystack.io/hub/integrations/jira)
  * Click the three dots next to JIRA integration and select "Update" .

    <figure><img src="https://downloads.intercomcdn.com/i/o/908473666/20aae0bc20f0d5f6a49a644d/Screenshot+2023-12-13+at+7.56.25%E2%80%AFPM.png" alt=""><figcaption></figcaption></figure>
* Update Integration Token
  * Generate a new token in JIRA with access to the specific board or project
* Update Integration in Haystack

  * Paste the new token in Haystack's JIRA settings.

  <figure><img src="https://downloads.intercomcdn.com/i/o/949148934/26cb97424840c35f660c4d72/Screenshot+2023-12-13+at+7.54.57%E2%80%AFPM.png" alt=""><figcaption></figcaption></figure>
* Verify Access
  * Check if you can now see the board or project.

</details>


# GitHub Cloud

See all your teams work from JIRA issues to Pull Requests in once place by integrating GitHub with Haystack.

{% hint style="info" %}
For more information on what data Haystack uses from Git, [here is an article!](/admin/security-and-privacy)
{% endhint %}

## Configure

{% tabs %}
{% tab title="Update integration" %}
{% hint style="info" %}
Default token would give a sync time of 30 minutes.

To improve the sync time to 10 seconds check [Real Time Data Sync](broken://pages/AFrpWnNzXLWNlfYFY9ca) doc.
{% endhint %}

1. Go to [Org settings -> Integrations -> Version Control](https://delivery.usehaystack.io/integrations/version-control).
2. Select `Connect GitHub -> GitHub Cloud`.
3. You will be redirected to GitHub connect page. Select which GitHub account to integrate to Haystack:

   <figure><img src="/files/C8hyKxhNeomVdEBhMyaP" alt=""><figcaption></figcaption></figure>
4. Select repositories. If you select specific repositories, you will have to give access to all newly created repositories later on:

<figure><img src="https://downloads.intercomcdn.com/i/o/254980857/b39ee9adafdcf09bc61f18b5/select-repos.gif" alt="" width="563"><figcaption></figcaption></figure>

5. **Redirection:**
   1. **You have permission to give access GitHub. I**f you see the above page, press "Continue" and move to Step &#x38;**:**

      <figure><img src="/files/Qfh9T1zggZzsj1nNRaDv" alt=""><figcaption></figcaption></figure>
   2. **Need approval from GitHub Admin.** If you don't have admin permissions in GitHub, you will need to receive approval from your GitHub admin and enter a token to link Github with Haystack:

      <figure><img src="/files/io6GpjCu8hkp9BW6rXZY" alt=""><figcaption></figcaption></figure>

      The GitHub admin will receive an email from GitHub to grant access to the organization. After they do it, they will be redirected to the Haystack page with the token:

      <figure><img src="/files/9l1VKBDty5EKKd57HV7w" alt=""><figcaption></figcaption></figure>

      **Important**: Inform the GitHub admin in advance not to close the page before copying the token. If they close the page, they will need to uninstall the Haystack app from Github and you will need to start Github integration from scratch.
6. Wait for the data to sync. This usually takes about 4 hours, but due to GitHub API limitations can extend up to 24 hours depending on the organization size.
   {% endtab %}
   {% endtabs %}


# GitHub Enterprise

See all your teams work from JIRA issues to pull requests in once place by integrating Github with Haystack.

{% hint style="info" %}
For more information on what data Haystack uses from Git, [here is an article!](/admin/security-and-privacy)
{% endhint %}

### For GitHub Enterprise (GHE) integrations, there are 5 high-level steps <a href="#h_d1b5377f79" id="h_d1b5377f79"></a>

1. **Open GHE firewall to Haystack IPs**
2. **Create the Haystack Github App**
3. **Generate App secrets**
4. **Install organization to the newly created GitHub App**
5. **Provide Haystack with the App secrets**

You can find detailed instructions on each step below.

### 1. Open GHE firewall to Haystack IPs <a href="#h_f97bf30913" id="h_f97bf30913"></a>

Haystack API uses the following IP addresses to connect to GHE.

```
35.209.159.249
35.208.83.132
35.208.18.170
35.209.170.63
```

For Haystack to access your servers, we'll need open firewall access to the given IPs.

### 2. Create the Haystack GitHub App <a href="#h_32118d1dc1" id="h_32118d1dc1"></a>

Open the organization you want Haystack to access, and go to the **Settings** page. Then, go to **GitHub Apps** in the **Developer Settings.**

<figure><img src="https://haystack-cf20ab244ac6.intercom-attachments-1.com/i/o/340840463/32b213a361ea0760aff4f6dd/7006b94e1988e0a153d09b8b03ac0738.png" alt=""><figcaption></figcaption></figure>

Click New GitHub App.

<figure><img src="https://athenian.intercom-attachments-7.com/i/o/325951393/6b640dc7527b8e0b2d750e51/Yx6UeRRs4OwJuqbgx924WckYWmDvTAiaLzgofBYa0DhZgjQrRqJqiEP6V95R52GmqnaqQUEMTUZFVSkRzzc2JfL02JnqcsVfdzrnxlbsKyB1XcF6EgN_GSiOr6ZOWxUUmC1U8t3W?expires=1621361372&#x26;signature=5aa87073b5f71fafc6f3acbd0774eab0d3ef4c9032620540b8e4db14189ed83a" alt=""><figcaption></figcaption></figure>

Here, fill in the following fields according to the detail below:

### Register new GitHub App <a href="#h_a1bb873d89" id="h_a1bb873d89"></a>

* **GitHub App name**: Haystack Enterprise
* **Homepage URL**: [https://dash.usehaystack.io](https://dash.usehaystack.io/)
* **User authorization callback URL**: <https://dash.usehaystack.io/onboarding/github-enterprise/complete>

  <figure><img src="https://downloads.intercomcdn.com/i/o/897667636/0687f7a179aeeb2264787bf3/Screenshot+2023-12-01+at+00.50.39.png" alt=""><figcaption></figcaption></figure>

### Webhook <a href="#h_af924b51e8" id="h_af924b51e8"></a>

* **Active**: ✅
* **Webhook URL**: <https://webhooks.usehaystack.io/integrations/vcs/github-enterprise>
* **Webhook secret**: Generate one using (*make sure to store this securely*)

  ```
  openssl rand -base64 500 | tr -dc 'a-zA-Z0-9' | fold -w 64 | head -n 1
  ```

<figure><img src="https://downloads.intercomcdn.com/i/o/340825279/e39fa08718d8936772f3e688/image.png" alt=""><figcaption></figcaption></figure>

### Permissions <a href="#h_9901cdbadb" id="h_9901cdbadb"></a>

Haystack requires the following permissions to give you insights. These permissions are in **read-only** mode:

*Repository permissions:*

* **Actions**
* **Administration**
* **Checks**
* **Contents**
* **Deployments**
* **Issues**
* **Metadata**
* **Pages**
* **Pull requests**
* **Webhooks**
* **Projects**
* **Commit statuses**
* **Dependabot alerts**

*Organization permissions:*

* **Members**
* **Administration**
* **Webhooks**
* **Plan**
* **Projects**
* **Blocking users**
* **Team discussions**

*User permissions:*

* ***No access to all***
* Commit comment

### Subscribe to events <a href="#h_97b7797d44" id="h_97b7797d44"></a>

Check the following items

| <ul><li><strong>Meta</strong></li><li><strong>Check suite</strong></li><li><strong>Create</strong></li><li><strong>Deployment key</strong></li><li><strong>Fork</strong></li><li><strong>Issue comment</strong></li><li><strong>Label</strong></li><li><strong>Member</strong></li><li><strong>Page build</strong></li><li><strong>Project card</strong></li><li><strong>Public</strong></li><li><strong>Pull request review</strong></li><li><strong>Push</strong></li><li><strong>Repository</strong></li><li><strong>Status</strong></li><li><strong>Team add</strong></li><li><strong>Org block</strong></li></ul> | <ul><li><strong>Security advisory</strong></li><li><strong>Check run</strong></li><li><strong>Delete</strong></li><li><strong>Deployment</strong></li><li><strong>Deployment status</strong></li><li><strong>Gollum</strong></li><li><strong>Issues</strong></li><li><strong>Milestone</strong></li><li><strong>Membership</strong></li><li><strong>Organization</strong></li><li><strong>Project</strong></li><li><strong>Project column</strong></li><li><strong>Pull request</strong></li><li><strong>Pull request review comment</strong></li><li><strong>Release</strong></li><li><strong>Repository dispatch</strong></li><li><strong>Star</strong></li><li><strong>Team</strong></li><li><strong>Watch</strong></li></ul> |
| ---------------------------------------------------------------------------------------------------------------------------------------------------------------------------------------------------------------------------------------------------------------------------------------------------------------------------------------------------------------------------------------------------------------------------------------------------------------------------------------------------------------------------------------------------------------------------------------------------------------------- | -------------------------------------------------------------------------------------------------------------------------------------------------------------------------------------------------------------------------------------------------------------------------------------------------------------------------------------------------------------------------------------------------------------------------------------------------------------------------------------------------------------------------------------------------------------------------------------------------------------------------------------------------------------------------------------------------------------------------------- |

In the final step, make sure to select **Any account** and click **Create Github App**:

<figure><img src="https://downloads.intercomcdn.com/i/o/340829550/78716b7a9c8119378a693ac5/image.png" alt=""><figcaption></figcaption></figure>

### 3. Generate App secrets <a href="#h_d3200909f2" id="h_d3200909f2"></a>

Take notes on the following items in a secure place.

* **App ID**
* **Client ID**
* **Client secret**
* **Public link**
* **Webhook Secret** (generated in the previous step)
* **Private Key**

<figure><img src="https://downloads.intercomcdn.com/i/o/340832452/298298d5d296c613485f9190/image.png" alt=""><figcaption></figcaption></figure>

On the same page, go to the Private keys section and press **Generate a private key**.

<figure><img src="https://downloads.intercomcdn.com/i/o/340832652/4ea42e214767500477bc02a2/image.png" alt=""><figcaption></figcaption></figure>

### 4. Install organization to the newly created GitHub App <a href="#h_ac5fec8730" id="h_ac5fec8730"></a>

We have created a GitHub App. Now we should allow the app to have access to the organizations you'd like to get insights.

On the left bar, go to **Install App** and press the **Install** button for the organizations you want Haystack to have access to.

*Note: You can install one or more organizations.*

<figure><img src="https://downloads.intercomcdn.com/i/o/340837328/98d9c73fbf2cc1fd9820f40d/image.png" alt=""><figcaption></figcaption></figure>

Afterward, select the repositories you'd like to get insights into and press **Install**.

<figure><img src="https://downloads.intercomcdn.com/i/o/340837507/5c279bb62b48e7d3865679ea/image.png" alt="" width="563"><figcaption></figcaption></figure>

### 5. Provide Haystack with the App secrets <a href="#h_8e34ce7fe5" id="h_8e34ce7fe5"></a>

<figure><img src="https://downloads.intercomcdn.com/i/o/907329574/e686d1157836a92121aa0547/Screenshot+2023-12-12+at+6.43.22%E2%80%AFPM.png" alt="" width="563"><figcaption></figcaption></figure>

Finally, copy over the following information from the above steps into Haystacks integration form.

* **App ID**
* **Client ID**
* **Client secret**
* **Public link**
* **Webhook Secret**
* **Private Key**

You have installed Haystack on your GitHub Enterprise organization successfully!


# GitLab

See all your teams work from JIRA issues to pull requests in once place by integrating Github with Haystack.

{% hint style="info" %}
For more information on what data Haystack uses from Gitlab, [here is an article!](/admin/security-and-privacy)
{% endhint %}

### For GitLab integrations, there are 3 high level steps <a href="#h_fdbbdd3724" id="h_fdbbdd3724"></a>

1. **Generate Personal Access Token**
2. **Provide Access Token to Haystack**
3. **(Only self-hosted) Open GitLab firewall to Haystack IPs**

You can find detailed instructions on each step below.

### 1. Generate Personal Access Token <a href="#h_a694d7f69c" id="h_a694d7f69c"></a>

You can [create as many personal access tokens](https://docs.gitlab.com/ee/user/profile/personal_access_tokens.html#creating-a-personal-access-token) as you like from your GitLab profile.

1. Log in to GitLab.
2. In the upper-right corner, click your avatar and select Settings.
3. On the User Settings menu, select Access Tokens.
4. Choose a name and optional expiry date for the token - Don't set any date.
5. Choose the desired scopes - For Haystack we need only api scope and read\_user scope..
6. Click the Create personal access token button.
7. Save the personal access token somewhere safe. Once you leave or refresh the page, you won’t be able to access it again.

Here is the example:

<figure><img src="https://downloads.intercomcdn.com/i/o/449487822/3cd10e1e86f1d98c12a821ba/Screen+Shot+2022-01-17+at+3.21.01+PM.png" alt="" width="563"><figcaption></figcaption></figure>

### 2. Complete Filling Out Information on Haystack <a href="#h_cf91a75a3c" id="h_cf91a75a3c"></a>

<figure><img src="https://downloads.intercomcdn.com/i/o/907311855/bafe3108a1c4632c139f8664/Screenshot+2023-12-12+at+6.26.54%E2%80%AFPM.png" alt="" width="563"><figcaption></figcaption></figure>

Copy paste the newly generated token into Haystack.

Click "Connect" and you are all done if you are not using a self managed Gitlab instance.

{% hint style="info" %}
If you have a self managed Gitlab instance, please continue reading.
{% endhint %}

### 3. (Only self-managed) Open GitLab firewall to Haystack IPs <a href="#h_833ff6d687" id="h_833ff6d687"></a>

If you have a self managed Gitlab instance, you will need to open firewall access to the following IP addresses Haystack uses to connect to GitLab.

```
35.209.159.249
35.208.83.132
35.208.18.170
35.209.170.63
```


# Bitbucket

Haystack accesses Bitbucket directly from JIRA integration. See how to integrate JIRA.


# Slack

Get notified on your teams achievements, risks and progress by integrating Slack with Haystack. To integrate Slack, follow the below steps!

### **1. Head to Integrations**

Select [integrations](https://dash.usehaystack.io/hub/integrations) from the top left drop down menu on your Haystack dashboard

<figure><img src="https://downloads.intercomcdn.com/i/o/924645806/dff17c6cdc7f425105942afe/Screenshot+2024-01-04+at+5.01.09%E2%80%AFPM.png" alt="" width="563"><figcaption></figcaption></figure>

### **2. You will now be redirected to the Slack to approve Haystack**

<figure><img src="https://downloads.intercomcdn.com/i/o/923692373/02f638e9d44d455e3c148121/Screenshot+2024-01-03+at+6.01.17%E2%80%AFPM.png" alt=""><figcaption></figcaption></figure>

1. **Click "Allow" on this page to approve Haystack Slack Integration**
2. **If you are a Slack admin, your integration is now complete**
3. **If you are not a Slack admin,**

   a. Contact your admin to approve your request.

   b. Once your Slack admin approved the request, your integration will be complete.

## FAQ

### Cannot find channel <a href="#h_70c375beca" id="h_70c375beca"></a>

Sometimes due to Slack API Limitations, we have trouble displaying all your channels. In these cases, you can always add the channel by using the [channel ID](https://stackoverflow.com/a/44883343).

### Cannot see private channels <a href="#h_9dc75dab6d" id="h_9dc75dab6d"></a>

This is caused due to private channels requiring explicit invitation of a Slack Bot.

You can invite the bot to a channel by typing `/invite @Haystack`.

<figure><img src="https://downloads.intercomcdn.com/i/o/947761281/4e8c65b9221694c7311a2ee6/Zappy+App.png" alt=""><figcaption></figcaption></figure>

After that bot has joined the channel, you might need to refresh the [page](https://dash.usehaystack.io/hub/settings/alerts) for the app to show you the newly accessible channel.

### Too Many Applications <a href="#h_aca9180c6d" id="h_aca9180c6d"></a>

Slack free tier allows only [10 applications](https://slack.com/intl/en-sg/help/articles/115002422943-Message-file-and-app-limits-on-the-free-version-of-Slack#:~:text=App%20installation%20limit,team%20count%20towards%20this%20limit) per workspace. There are two ways to move forward;

1. [Upgrade to Slack paid plan](https://app.slack.com/plans) and have unlimited application slots
2. Delete an unused application to free a slot. You can achieve this by going to [slack.com/apps](https://slack.com/apps) and navigating to "Manage" link on the top right corner.

### Internal Server Error <a href="#h_3f5abc1df9" id="h_3f5abc1df9"></a>

After allowing permissions to Haystack Slack Bot, you should be redirected to the [Integrations page](https://dash.usehaystack.io/hub/integrations/slack). Instead of redirecting, if you see Internal Server Error, please reach out to us by emailing <support@usehaystack.io> or messaging us from Intercom chatbot on the bottom right corner of every page.


# Organization

Organization settings are global settings that includes access management & global data settings

<figure><img src="https://cdn.zappy.app/8c7aaee804fccf0093145dbd0c3eb18c.png" alt=""><figcaption></figcaption></figure>

org


# Investments

How to setup Investments in Haystack?

Track how your teams resources are spent over time by setting up investment categories on Haystack.

Follow the below step to set them up.

## Setup Investments <a href="#h_f9275c4125" id="h_f9275c4125"></a>

1\. Open "Investments" page

Head to [Investments](https://dash.usehaystack.io/hub/investments) from in org settings.

<figure><img src="https://downloads.intercomcdn.com/i/o/1017307797/2a19e445c7461183dd725c8c/Screen+Shot+2024-04-10+at+2_09_21+PM.png?expires=1712754847&#x26;signature=fcf3d5fc2c40503dae7668d64a8d7d9e64fa69af04cb714ae06dda3c6a24c79c" alt=""><figcaption></figcaption></figure>

2\. Edit, delete or add Investments from here

You can

* Add Investments
* Edit Investments
* Delete Investmenets

<figure><img src="https://downloads.intercomcdn.com/i/o/923745378/e26e23670da13c5e16479668/Screenshot+2024-01-03+at+6.57.26%E2%80%AFPM.png?expires=1712754847&#x26;signature=0c5fbba954729bb0c678851f3260eced6ced45b6d2a439ffa73abb5e6cee5882" alt=""><figcaption></figcaption></figure>

3\. Define Investment Criteria

Below is an example of a category inside Haystack's own team to track all our initiatives around Technical debt using JIRA epics.

{% hint style="info" %}
Check [What categories should I track](#h_6ca4a01e75)?
{% endhint %}

\
Each Investment will have

* **Color**: Same color will be used in the rest of the app representing the investment
* **Name**: Name shown in the rest of the app
* **Description (optional)**: Shown only in Investments setting page. Used to ensure other members in the organization can understand what the investment represents
* **Filter**: Issues are tagged with an investments based on the filters set.

<figure><img src="https://downloads.intercomcdn.com/i/o/924703773/80a93e824c7f73cee337bf9f/Screenshot+2024-01-04+at+6.09.30%E2%80%AFPM.png?expires=1712754847&#x26;signature=cc218e6f276ee640349b62b53a2795cbffe357c5be93590e03dca2f6ecbdc453" alt=""><figcaption></figcaption></figure>

You can any of the following properties of an issue as filter

* Project
* Assignee
* Priority
* Issue Type
* SLA status
* Epic
* Label
* Title
* Custom Field

with the following operators

* is
* is not
* contains
* exists
* does not exist

Each filter can have And/Or operators.

<figure><img src="https://downloads.intercomcdn.com/i/o/1017310386/fa4b884e300d9d779dfd40c8/Screen+Shot+2024-04-10+at+2_12_01+PM.png?expires=1712754847&#x26;signature=bdeed28c59fbfca56d00502ea2a0512146e2e090deeb8be4f1fd1613eec67036" alt=""><figcaption></figcaption></figure>

4\. See Issues that fit Investments filters

At the bottom of Investment definition Haystack shows how many issues fit into the rules you have selected.

<figure><img src="https://downloads.intercomcdn.com/i/o/1017324231/40d9a3a42b493ec599b015d6/Screen+Shot+2024-04-10+at+2_25_06+PM.png?expires=1712754847&#x26;signature=77554b5d222f3e143dfe5d50d72ca646ef51e014e01b460b43ad860cc1bf5a3c" alt=""><figcaption></figcaption></figure>

You can click on the text to see all issues that fit your filters. You can edit the metadata shown in the table by clicking the "View" dropdown allowing you to ensure the correct Issues are tagged.

<figure><img src="https://downloads.intercomcdn.com/i/o/1017323864/d867062e858e8bd1b5567ad7/Screen+Shot+2024-04-10+at+2_24_49+PM.png?expires=1712754847&#x26;signature=b1f7ea7e068a6afa851c19ff14df0350fd033adc5ac74789db8efaa4e2cd9bad" alt=""><figcaption></figcaption></figure>

5\. Prioritize Investments

An issue can only be tagged to a single investment category.

If an issue fits into multiple categories, Haystack tags the issue to the top most fitting category.

You can change the order of the investment categories by holding the 6 dots icon next to them.

Any issue which does not fit to any category will belong to "Uncategorized" section. Uncategorized section cannot be ordered, removed or edited.

<figure><img src="https://downloads.intercomcdn.com/i/o/1017320126/183b78adf82d8a2673b465f6/Screen+Shot+2024-04-10+at+2_21_14+PM.png?expires=1712754847&#x26;signature=d5b9fcf205b40f7006f40d81f849cadf39431f9e8ef2a574d14081915fac7159" alt=""><figcaption></figcaption></figure>

## Reporting Investment Categories <a href="#h_ae5488773f" id="h_ae5488773f"></a>

Once investments are setup, you will be able to create custom reports grouped by or filtered by Investments

Investment are shown in [retros page](https://delivery.usehaystack.io/team/retrospective), [metrics page](https://dash.usehaystack.io/hub/team/metrics) or the [reports page](https://dash.usehaystack.io/hub/reports).

### Retro Report <a href="#h_9656a8d47b" id="h_9656a8d47b"></a>

In [Retros Report](https://delivery.usehaystack.io/team/retrospective)[,](#h_9656a8d47b) you can see Investments across all your sprints/weeks. This will allow you to have a quick glance on where you spend your time.

<figure><img src="https://downloads.intercomcdn.com/i/o/1017327778/e3ffb5875f05a3cce553f8e0/Screen+Shot+2024-04-10+at+2_28_17+PM.png?expires=1712754847&#x26;signature=b28c63a67816d33d1d44f3ef229439efe289fb0f4395e8293344e650dbc90238" alt=""><figcaption></figcaption></figure>

If you click on any of the Retro Reports, you can see Investment for that particular sprint/week.

<figure><img src="https://downloads.intercomcdn.com/i/o/1017328271/2d809ed8570fafc4e503153d/Screen+Shot+2024-04-10+at+2_28_40+PM.png?expires=1712754847&#x26;signature=d9fd23a7862e66fdee0c3a1aab8cd4d54b28824ecea431a8890c86ba5714720f" alt=""><figcaption></figcaption></figure>

### Investment Report <a href="#h_351261f9ff" id="h_351261f9ff"></a>

In both [metrics page](https://dash.usehaystack.io/hub/team/metrics) or the [reports page](https://dash.usehaystack.io/hub/reports) you can create an Investment Report.

You can select any "Issue" based metric

#### Option #1: Filter By Investments <a href="#h_2b8c15af92" id="h_2b8c15af92"></a>

You can filter out issues by investments using the `Filter` button.

<figure><img src="https://downloads.intercomcdn.com/i/o/1017334316/e152727ce50deb71ff3e621a/Screen+Shot+2024-04-10+at+2_33_53+PM.png?expires=1712754847&#x26;signature=3594ef7fd4fefb47e45062d20390154caf0f69d855cac87ee1b22bd8514fe688" alt=""><figcaption></figcaption></figure>

#### Option #2: Group By Investments <a href="#h_93ef56d9d2" id="h_93ef56d9d2"></a>

You can group issues by investments by using `Group by: Investments` option.

<figure><img src="https://downloads.intercomcdn.com/i/o/923747221/b61a3f41f10e31c5ea9c366c/Screenshot+2024-01-03+at+6.58.07%E2%80%AFPM.png?expires=1712754847&#x26;signature=d7cdb32f9a8801f022fd74062e2e94f307f5f3dda17d242ca5799bdc1ad5b090" alt=""><figcaption></figcaption></figure>

***

## FAQ <a href="#h_6fcb1af857" id="h_6fcb1af857"></a>

### How do you prevent duplicates? <a href="#h_8cb597fb6e" id="h_8cb597fb6e"></a>

Each issue is assigned one category. We use the [category priorities](#h_8554d0fc82) you’ve created in your settings to determine a ranking order. We process every issue, cross-check against your category definitions (in order of your priorities), and assign that issue to the first category match. That issue will not be assigned to lower priority categories even if there is a match found.

### What if different teams use different labelling? <a href="#h_a1fe40b0b0" id="h_a1fe40b0b0"></a>

Haystack gives flexible tooling allowing you to have an abstraction across different teams.

You can check the [full list of tooling](#h_ec5498e3b1) provided.

### What categories should I track? <a href="#h_6ca4a01e75" id="h_6ca4a01e75"></a>

Haystack provides a flexible engine to tag your issues. The system does not have opinions, however, we do have recommendations.

* Dropbox's [KTLO framework](https://medium.com/engineering-operations/a-framework-for-balancing-and-budgeting-engineering-resourcing-d0cce0e6911c).
  * New Stuff
  * Improve Stuff
  * Productivity
  * Keep the lights on
* Product Focused Team
  * Roadmap Item
  * Non-roadmap Item
  * Bugs
* Technical Focused Teams
  * New Features
  * Bugs
  * Technical Debt

Feel free to choose whichever one that fits your organizations goals the best.

### What if I change my category definitions? <a href="#h_19ab4bf4c8" id="h_19ab4bf4c8"></a>

It takes a few minutes for Haystack to tag every issue after any updates on Investment categories.

After the update process is completed, all your investment reports will reflect the changes.

### How often are categories applied? <a href="#h_bf5127bd0a" id="h_bf5127bd0a"></a>

Haystack runs batch tagging for investments.

Initial setup can take up to 3-5 minutes to tag all issues. However, any issue creation/updates can take up to 15 minutes to reflect the Investment category changes.


# Deployments

How to setup Deployment Frequency in Haystack

Quickly measure how fast your teams are deploying and delivering value to customers by setting up deployments on Haystack. To configure deployments, follow the below steps

1\. Head to Deployment Settings

Head to [deployments](https://dash.usehaystack.io/hub/deployments) settings by

* clicking gear icon on first sidebar
* clicking Deployments on second sidebar

<figure><img src="https://downloads.intercomcdn.com/i/o/954575182/2b9623ada582d53c4bdeb759/3059e8fcfa68c4dd52678176296aa43a.png" alt=""><figcaption></figcaption></figure>

2\. Click on "New Service"

<img src="https://downloads.intercomcdn.com/i/o/923751789/38d3e459dd4e73c084d094ca/Screenshot+2024-01-03+at+7.05.05%E2%80%AFPM.png" alt="" width="2696">

3\. Provide a name and description for your service

<figure><img src="https://downloads.intercomcdn.com/i/o/923752011/4627be251b3de1749d02e8bb/Screenshot+2024-01-03+at+7.05.21%E2%80%AFPM.png" alt=""><figcaption></figcaption></figure>

4\. Create an environment for Deployment

Typically companies have 2 environments

* staging environment
* production environment

You'd want to set both of these separate to measure them accurately

<figure><img src="https://downloads.intercomcdn.com/i/o/924693727/7078bd1deb6fffb141160e06/Screenshot+2024-01-04+at+5.59.54%E2%80%AFPM.png" alt=""><figcaption></figcaption></figure>

5\. Setup how to identify each deployment

Haystack can identify deployments based on different identifiers

1. Commit - tags each commit as a deployment
2. Pull Request - tags each pull request as a deployment
3. GitLab Deployments - tags GitLab deployments as a deployment

<figure><img src="https://downloads.intercomcdn.com/i/o/954577206/4bdbd77ccaf0331576701663/Zappy+App+Screenshot+%282%29.png" alt=""><figcaption></figcaption></figure>

Each option allows you to have conditional where clauses. You can filter by anything from Author, Title, Tag, Repository and more.

<figure><img src="https://downloads.intercomcdn.com/i/o/954578117/3ffa4bf7f19632a72af64597/Z.png" alt=""><figcaption></figcaption></figure>

Typically we suggest our customers to use tag your deployments using Git tags and then use that to identify deployments on Haystack

Best practices for deployment identifier

{% hint style="info" %}
If you are settings up deployment processes, we suggest tagging each deployment commit with `{env}` and `{version}` information. Ex: `prod-v1.2.3`.

The main reasons are

1. Commits are source of truth on what production runs.
2. Commits are easily revertible to old version
3. Commit tags live together with your code. Finally, a source of truth.
4. Easy to standardize across teams, projects, repositories.
5. No data lock-in. Haystack doesn't own the data, you do!
6. Easily integrated with CI tools like Jenkins, Github Actions, Circle CI, etc.
7. Complete control. You control when, how, and what system tags your releases.

As long as the whole organization is using Git, it can be standardized across all teams regardless of the tools they use.
{% endhint %}

6\. Confirm the deployments are setup correctly using the preview & save

Gain confidence on your settings by clicking the "8 deployments" link.

<figure><img src="https://downloads.intercomcdn.com/i/o/924697933/9343dc0310d14fe75d971394/Screenshot+2024-01-04+at+6.01.27%E2%80%AFPM.png" alt=""><figcaption></figcaption></figure>

7\. Track deployments

You will now be able to track your teams deployments over time from both your teams[ metrics page](https://dash.usehaystack.io/hub/team/metrics) or [reports page](https://dash.usehaystack.io/hub/reports)

<figure><img src="https://downloads.intercomcdn.com/i/o/923755149/3e223c06b15f8e7484e1606d/Screenshot+2024-01-03+at+7.09.03%E2%80%AFPM.png" alt=""><figcaption></figcaption></figure>


# Invite users

To invite members to Haystack, follow the below steps:

**1. Head to Members**

[Head to members](https://dash.usehaystack.io/hub/members) by clicking on the menu on the top left corner of your Haystack dashboard

<figure><img src="https://downloads.intercomcdn.com/i/o/923739382/b0d8a83d206a25e8c15e13a3/Screenshot+2024-01-03+at+6.51.56%E2%80%AFPM.png" alt=""><figcaption></figcaption></figure>

**2. Click on "Invite Members"**

<figure><img src="https://downloads.intercomcdn.com/i/o/923740128/de7934c0a29385e7ce36a357/Screenshot+2024-01-03+at+6.52.01%E2%80%AFPM.png" alt=""><figcaption></figcaption></figure>

**3. Give invitee details**

Type the list of emails of members you'd like to invite & select the Haystack team you'd like them to be automatically added to

<figure><img src="https://downloads.intercomcdn.com/i/o/923740663/d40b8c88d0962e1e7bc63e03/Screenshot+2024-01-03+at+6.52.13%E2%80%AFPM.png" alt=""><figcaption></figcaption></figure>

**4. Click send**

The invited members should now have received an email to login to Haystack


# Exclusions

## Overview

Exclusions help you improve your data accuracy by excluding issues from calculations that were canceled, not completed, deprecated, etc.

## Configure

1. Go to [Organization settings -> Exclusions](https://delivery.usehaystack.io/investments)
2. Click `Configure`

   <figure><img src="/files/xgmG7PyTpr9RfS4aXbaF" alt=""><figcaption></figcaption></figure>
3. Select statuses and resolutions that you want to exclude

   <figure><img src="/files/uVrpUK1PAJZ8VXInmIAj" alt=""><figcaption></figcaption></figure>
4. Click `Save`

   <figure><img src="/files/iDBSCBnEZ7wSecH6uhR8" alt=""><figcaption></figcaption></figure>

After that Haystack will recalculate all of your historical data, excluding statuses and resolutions that you’ve selected.&#x20;

Recalculating all historical data will take up to 10 minutes.

{% hint style="warning" %}
Updating exclusions might change historical data for all teams
{% endhint %}

## FAQ

<details>

<summary>Will exclusions change my historical data?</summary>

Yes, after exclusions are applied, all your historical data will be recalculated

</details>

<details>

<summary>How long it takes to update all metrics after exclusions are updated?</summary>

Recalculating all historical data will take up to 10 minutes

</details>


# Teams

Teams are Haystack's abstraction layer on top of JIRA & version control.

## Create Team

See all your team members work in a single place to identify risks, blockers & more by creating a team on Haystack. To do so, follow the steps below!

**1. Give your team a name and select your teams JIRA board from the dropdown**

<figure><img src="https://downloads.intercomcdn.com/i/o/923701753/7e1cc8d371276197e4794ed0/Screenshot+2024-01-03+at+6.10.43%E2%80%AFPM.png" alt=""><figcaption></figcaption></figure>

**2. Select your team members**

Once the board is selected, Haystack will auto-populate your team members. Any member who was assigned, created or reported an issue in the last 30 days inside the board is automatically included in the team. We suggest double checking this list to ensure your team members are setup correctly.

<figure><img src="https://downloads.intercomcdn.com/i/o/923704648/fcf8fb0d7a39b198483e3c83/Screenshot+2024-01-03+at+6.12.52%E2%80%AFPM.png" alt=""><figcaption></figcaption></figure>

**3. Map your team members Git & Slack**

Haystack will also automatically map your members Git & Slack accounts to JIRA account. You will also now want to manually map any members Haystack could not automatically map.

<figure><img src="https://downloads.intercomcdn.com/i/o/923704648/fcf8fb0d7a39b198483e3c83/Screenshot+2024-01-03+at+6.12.52%E2%80%AFPM.png" alt=""><figcaption></figcaption></figure>

## FAQ

### Not able to find Git members?

Please ensure the repository is already integrated with Haystack. You can find more information on there[ here](broken://pages/tyikv4B7cbGZu6krkU17)

### Not able to find Slack members?

If you are unable to find Slack members, please integrate Slack first by following the steps [here](/setup/integrations/slack)

### Should I create multiple teams? Or one team containing all members?

Create teams which match your working groups. If you'd like to report across teams, this is still possible via [Haystack Reports](https://delivery.usehaystack.io/reports)


# Map members

Bring all your teams work in once place to identify risks, blockers & much more by linking your team members on Haystack

To make sure you team members are linked correctly, follow the below steps

**1. Head to** [**Team settings**](https://dash.usehaystack.io/hub/settings) **from the left sidebar**

<figure><img src="https://downloads.intercomcdn.com/i/o/923709584/2dc504c1dc1a155767d6d8f9/Screenshot+2024-01-03+at+6.22.33%E2%80%AFPM.png" alt=""><figcaption></figcaption></figure>

**2. Select members**

<figure><img src="https://downloads.intercomcdn.com/i/o/923710614/424ec8b6d2c416bcb2713aaf/Screenshot+2024-01-03+at+6.23.45%E2%80%AFPM.png" alt=""><figcaption></figcaption></figure>

**3. Map members**

For each member, make sure a Git acccount & Slack account is selected. If you are not able to find the matching Git account for the JIRA team member, please make sure the Git repository with the member is integrated with Haystack

## FAQ <a href="#h_2f967536f7" id="h_2f967536f7"></a>

<details>

<summary>Not able to find Git members?</summary>

Please ensure the repository is already integrated with Haystack.&#x20;

</details>

<details>

<summary>Not able to find Slack members?</summary>

If you are unable to find Slack members, please integrate Slack first by following the steps [here](/setup/integrations/slack)

</details>


# Sprint success metric

Setup a key metric for your team that helps you evaluate the success of a sprint.

### Basics

Haystack provides two options as a sprint success metric:

1. **Completion Rate** (default): the percentage of work completed against the total sprint scope, including any scope changes during the sprint.
2. **Commitment Reliability**: the percentage of work completed from the initial sprint plan, excluding any scope changes mid-sprint. Choose this metric if you want to:&#x20;
   1. Ensure team stays on track with original sprint commitments
   2. Identify gaps between planned and completed work

### What will be impacted

Based on your sprint success metric selected in settings, you will see changes in all sprint-related pages: Issues, Retro, Sprint review.

{% tabs %}
{% tab title=" Issues" %}

<figure><img src="/files/ZFNYZwgxk30pBxTz9wCq" alt=""><figcaption><p>Sprint success metric is shown in overview section</p></figcaption></figure>
{% endtab %}

{% tab title="Retros" %}

<figure><img src="/files/2kiK74dh6hHwllwwnYZk" alt=""><figcaption><p>Sprint success metric is shown in retros page table</p></figcaption></figure>

{% endtab %}

{% tab title="Sprint review" %}

<figure><img src="/files/USZph9uOvli8xd1sQXcu" alt=""><figcaption><p>Sprint success metric is shown in retros page table</p></figcaption></figure>
{% endtab %}
{% endtabs %}

### Setup

1. Head to the [Teams Settings](https://dash.usehaystack.io/hub/settings) page via the Settings icon on the left sidebar

   <figure><img src="/files/IpWJJvizO75TEySDv5Lv" alt=""><figcaption></figcaption></figure>
2. Navigate to '[Board](https://dash.usehaystack.io/hub/settings/board)' settings and select metric in "Sprint success metric" section:

   <figure><img src="/files/yN7hLOIR2FUavS33UYFo" alt=""><figcaption></figcaption></figure>
3. Click Save.

## FAQ <a href="#h_2f967536f7" id="h_2f967536f7"></a>

<details>

<summary>Does the 'Sprint Success Metric' apply retroactively?</summary>

Yes, metric will be applied retroactively to all past sprints for the team.&#x20;

</details>

<details>

<summary>Do issues removed mid-sprint impact commitment reliability?</summary>

Yes, removing issues mid-sprint is considered a scope change and will affect the sprint reliability metric.

</details>

<details>

<summary>Does a high Commitment Reliability indicate a successful sprint?</summary>

Not necessarily. While high Commitment Reliability indicates good planning, factors like long-term goals, value delivered, and team capacity are equally important.

</details>

<details>

<summary><strong>When should Commitment Reliability be used over Completion Rate?</strong></summary>

Commitment Reliability is ideal for improving sprint planning accuracy, assessing adherence to initial commitments, reducing scope changes, and enhancing delivery predictability.

</details>


# Capacity

Get alerted you when your team is over capacity by setting up capacity on Haystack. To set this, follow the below steps!

**1. Head to**[ **team settings**](https://dash.usehaystack.io/hub/settings)

<figure><img src="https://downloads.intercomcdn.com/i/o/923713072/b7e5bda0813e678777835f55/Screenshot+2024-01-03+at+6.22.33%E2%80%AFPM.png" alt=""><figcaption></figcaption></figure>

**2. Go to board**

<figure><img src="https://downloads.intercomcdn.com/i/o/923713413/ff8169bce52e32e200a5da9b/Screenshot+2024-01-03+at+6.26.45%E2%80%AFPM.png" alt=""><figcaption></figcaption></figure>

**3. Set the relevant capacity under "Capacity guideline"**

Haystack will automatically suggest your teams typical capacity based on historical data

<figure><img src="https://downloads.intercomcdn.com/i/o/924691072/f429ae224087390da73f13d1/Screenshot+2024-01-04+at+5.57.28%E2%80%AFPM.png" alt=""><figcaption></figcaption></figure>


# Alerts

Promptly get notified on your teams risks, accomplishments and even send out AI generated release notes automatically by setting up alerts on Haystack!

{% hint style="info" %}
To enable alerts, you will first need Slack integrated. If not, please follow instructions here: [Integrate Slack](/setup/integrations/slack)
{% endhint %}

Once the Slack is integrated, follow the below steps to enable relevant alerts

**1. Head to** [**team settings**](https://dash.usehaystack.io/hub/settings/alerts)

<figure><img src="https://downloads.intercomcdn.com/i/o/923724912/e32e7eb66e35e5eddfd48825/Screenshot+2024-01-03+at+6.22.33%E2%80%AFPM.png" alt=""><figcaption></figcaption></figure>

**2. Head to Alerts**

<figure><img src="https://downloads.intercomcdn.com/i/o/929608436/f36224ca9de95b499eab19d9/Screenshot+2024-01-10+at+6.09.53%E2%80%AFPM.png" alt=""><figcaption></figcaption></figure>

**3. Setup Progress & Achievement Alerts**

a. Choose your teams Slack channel to start receiving progress & achievement alerts

b. Select the relevant alerts to be enabled

c. Hover over the tooltip next to each alert to see a quick preview

<figure><img src="https://downloads.intercomcdn.com/i/o/929608733/80f10b5809466ff0e128fd03/Screenshot+2024-01-10+at+6.08.46%E2%80%AFPM.png" alt=""><figcaption></figcaption></figure>

**4. Setup Risk Alerts**

a. We recommend sending risk alerts to the team's manager

b. Select the relevant alerts to be enabled

c. Hover over the tooltip next to each alert to see a quick preview

<figure><img src="https://downloads.intercomcdn.com/i/o/929609279/8566fe81338c33e0ee34639a/Screenshot+2024-01-10+at+6.08.49%E2%80%AFPM.png" alt=""><figcaption></figcaption></figure>

{% hint style="info" %}
Check [Alerts](/features/alerts) for more info on each alert
{% endhint %}

<br>


# SLAs

Track SLAs from our dashboard and get alerted on Slack when they are broken by setting SLAs on Haystack. Follow the below steps to set them up!

**1. Head to** [**team settings**](https://dash.usehaystack.io/hub/settings)

<figure><img src="https://downloads.intercomcdn.com/i/o/923733406/7606e9e56387390e2fa24afc/Screenshot+2024-01-03+at+6.22.33%E2%80%AFPM.png" alt=""><figcaption></figcaption></figure>

**2. Head to SLAs**

<figure><img src="https://downloads.intercomcdn.com/i/o/923733801/1676bf9401fc1fb7c1654543/Screenshot+2024-01-03+at+6.47.23%E2%80%AFPM.png" alt=""><figcaption></figcaption></figure>

#### **a. Set the numbers of days for the SLAs**

Haystack automatically applies SLAs to any JIRA issue of type Bug. You can set a custom at-risk and broken day threshold based on the bugs priority

#### **b. (Optional) Turn on SLA alerts**

You may now head to Alerts on the same team settings to turn on Slack alerts when an SLA is at-risk or is broken

<figure><img src="https://downloads.intercomcdn.com/i/o/923736515/21ed0954529cb7a608b4128e/Screenshot+2024-01-03+at+6.40.04%E2%80%AFPM.png" alt=""><figcaption></figcaption></figure>

**3. Track SLAs on Active Cycle page**

Once SLAs are set, you can now filter your JIRA issues based on SLAs from your Haystack dashboard

<figure><img src="https://downloads.intercomcdn.com/i/o/924687028/902d1b7d69f99812ea59cd7b/Screenshot+2024-01-04+at+5.52.55%E2%80%AFPM.png" alt=""><figcaption></figcaption></figure>


# Risks

## Overview

Identify your blockers faster & get alerted by setting up risks on Haystack.&#x20;

## Configure

To configure risks in team settings, go to **team settings -> issue risks** or **team settings -> PR risks.**

## Basics

### **Issue risks**

Haystack provides two types of Issue risks:

1. **Stuck**\
   When issue takes too much time in status, Issue is considered as "stuck" when it stays too much time in particular status category or status. You can set your own rules when issue should be considered as "Stuck".
2. **Blocked**\
   Issue is considered as "Blocked" when it is marked in Jira as blocked by another issue. In order to mark issue as blocked in Jira, you need to [link issue](https://support.atlassian.com/jira-software-cloud/docs/link-issues/) and select "is blocked by" link type.

### **PR risks**

In PR risks, you will find potential risks you can configure for your pull requests. You may turn these on/off and set your threshold heres

<figure><img src="https://downloads.intercomcdn.com/i/o/923718354/983f6369c11b0da8b0a8f072/Screenshot+2024-01-03+at+6.30.31%E2%80%AFPM.png" alt=""><figcaption><p>PR risks settings page</p></figcaption></figure>

### **Quick filters**

Once Risks are set, you will see risky work on the **Issues** and **Pull Requests** pages in the right sidebar.

<figure><img src="https://downloads.intercomcdn.com/i/o/924689376/e12dd2cfd1651890f9197038/Screenshot+2024-01-04+at+5.52.55%E2%80%AFPM.png" alt=""><figcaption><p>Issue page risks filters</p></figcaption></figure>

### **Alerts**

Setup [Slack alerts](/setup/teams/alerts) and Haystack will notify you when risk is detected.

<figure><img src="/files/8OwvQUFjR1niRfinSh5Q" alt=""><figcaption><p>Example of not linked Pull Request risk alert</p></figcaption></figure>


# Issues

See issues that are in progress

This blog will go over how to use [Issues](https://delivery.usehaystack.io/team/standup) page in Haystack.

## Recent Activity <a href="#h_1514247375" id="h_1514247375"></a>

### Last 24hrs Activity <a href="#h_8439a26fcd" id="h_8439a26fcd"></a>

This view allows your to see all activity changes across Git & Jira for any issue.

<figure><img src="https://downloads.intercomcdn.com/i/o/1014960268/458d97dfcc8ee07004c61b7a/Screen+Shot+2024-04-08+at+2_13_58+PM.png?expires=1712676259&#x26;signature=689b7e29e4e3a00e0d45c711c57f3d88bfe306a4443b0dd0acc572c27a71f92e" alt=""><figcaption></figcaption></figure>

You can understand majority of what has happened in the last 24 hours.

<figure><img src="https://downloads.intercomcdn.com/i/o/1015265574/cba531e2939895bf59a473fe/Screen+Shot+2024-04-08+at+6_07_07+PM.png?expires=1712676259&#x26;signature=f9e899a5ea4ca965b45a24ad24d74bb7bc86b095ad9a2f4b2c35fdf66a65d425" alt=""><figcaption></figcaption></figure>

You can update the time frame to

* Last 24 hours
* Last 48 hours
* Last 72 hours
* Last 96 hours

This is particularly useful on Monday's when you want to understand what happened since Friday.

<figure><img src="https://downloads.intercomcdn.com/i/o/1014975662/eca49f273d48d54521b8c4dc/Screen+Shot+2024-04-08+at+2_26_44+PM.png?expires=1712676259&#x26;signature=607b74f770e9d438873181778e946a5f89f0bb21fb13f04d6c0e5f1aff06076c" alt=""><figcaption></figcaption></figure>

**Note:**

* Last 24h view respects [member filters](#h_5598727cba) & [board customizations](#h_c670470016).

### Activity Bubbles <a href="#h_17c5e5b00e" id="h_17c5e5b00e"></a>

Haystack combines both Jira & Git activity into a single activity bar. The more activities there are the bigger the bubble is.

You can hover over each bubble and see all the activity that has happened.

Bubble colors have meaning

* Light Blue: Only Jira Activity
* Dark Blue: Has at least one Git Activity

This allows you to see more intentful activities like Git commits and less intentful activities like Jira priority changes.

<figure><img src="https://haystack-cf20ab244ac6.intercom-attachments-1.com/i/o/1021869357/3ca148758c28a383a9bf89b8/f5eadb06e2aed1d07a89c5e01cd70420.png" alt=""><figcaption></figcaption></figure>

**Note:**

* If you are using multiple version control systems like Github & Gitlab together, both of their activities will be shown as long as the [Pull Requests are linked](#h_99088c5f36).

### Time in Status <a href="#h_5ce60b1f64" id="h_5ce60b1f64"></a>

You can view both

* **Time in status**: Time spent in that status (column)
* **Time in progress**: Total time spent in-progress

These allow you to see if any issue stuck for a long period of time that might need your attention.

<figure><img src="https://downloads.intercomcdn.com/i/o/1014982851/0002736e9a843720cc4f1c0d/Screen+Shot+2024-04-08+at+2_32_33+PM.png?expires=1712676259&#x26;signature=332c647acbdf1a2ce4df627d97ab0c1dc3aed300851de8256d78923edce22c39" alt=""><figcaption></figcaption></figure>

### Filter by Member <a href="#h_5598727cba" id="h_5598727cba"></a>

Member filter allows you to see all the issues in that cycle.

<img src="https://downloads.intercomcdn.com/i/o/1014946935/7e4f892bc0ecb1887d3dddec/1e58e1adcc47b366a60d52cae66fd771.png" alt="" width="2338">

### Potential Risks <a href="#h_a19972535d" id="h_a19972535d"></a>

Risk sections allows you to easily filter across the risks you have selected.

Each risk is configurable

* [SLA configs](https://delivery.usehaystack.io/team/settings/sla)
* [Risk configs](https://delivery.usehaystack.io/team/settings/risks/issues)

<figure><img src="https://downloads.intercomcdn.com/i/o/1015002933/4d99a27bff08c72603515514/Screen+Shot+2024-04-08+at+2_48_41+PM.png?expires=1712676259&#x26;signature=6c97aecb442742296fdaed76f4876170638d5f42bf7b656e4a85d3192fa99ce0" alt=""><figcaption></figcaption></figure>

Once a risk is configured, you'll see a corresponding icon appearing next to issues which have this risk.

You can hover over the icons to see further details.

<figure><img src="https://downloads.intercomcdn.com/i/o/1015006654/6af5352794e45ff3f9c5dbdb/Screen+Shot+2024-04-08+at+2_51_00+PM.png?expires=1712676259&#x26;signature=97b8739e016e71c3dec881c498e5bb08fd76257e1aa07e9bc94af075d78e2e86" alt=""><figcaption></figcaption></figure>

{% hint style="info" %}
You can [set alerts](https://delivery.usehaystack.io/team/settings/alerts) when an issue is above it's stuck threshold or when an SLA is at risk.
{% endhint %}

### Progress Timeline <a href="#h_f7d69cca4d" id="h_f7d69cca4d"></a>

The timeline shows different for Kanban & Sprint teams.

* **Kanban**: Shows Monday to Sunday
* **Sprint**: Shows start of sprint to end of sprint

Kanban version is a more vanilla version of the Sprint Progress Timeline.

<figure><img src="https://downloads.intercomcdn.com/i/o/1015008784/9a97c44a8f42dd82d3d9aa59/Screen+Shot+2024-04-08+at+2_52_43+PM.png?expires=1712676259&#x26;signature=b2f027357bec38dd1fa84777892ae71e7f83f81a8b2c0e0233718a90e17a5d47" alt=""><figcaption></figcaption></figure>

If you [set capacity via settings](https://delivery.usehaystack.io/team/settings/board), you will be able to see one more line in the graph called "Capacity" in the graph.

{% hint style="info" %}
You can [set alerts](https://delivery.usehaystack.io/team/settings/alerts) when the team goes over the set sprint capacity
{% endhint %}

### Editable Fields <a href="#h_442bd67f98" id="h_442bd67f98"></a>

You can edit most field in the tables just by clicking of them.

The fields that are editable are

* Issue Type
* Priority
* Storypoints
* Assignee

<figure><img src="https://downloads.intercomcdn.com/i/o/1015113735/5596aa7e29ddacb99167e51c/Screen+Shot+2024-04-08+at+4_12_02+PM.png?expires=1712676259&#x26;signature=f16f6a0f5b661c671267b0635891bfc5acd5dce6ae9a4f89e6de49154ab55310" alt=""><figcaption></figcaption></figure>

### View Issue Metadata <a href="#h_fb2bc566e5" id="h_fb2bc566e5"></a>

Clicking on any issue will bring up Issue Details side panels. This panel allows you to take a deeper dive into what's happening.

<figure><img src="https://downloads.intercomcdn.com/i/o/1014996922/0196b5ed225dda321f74888a/Screen+Shot+2024-04-08+at+2_44_04+PM.png?expires=1712676259&#x26;signature=fb3c5992c847910f02b35be268844d2548dae4318ac2699ca4571b2de1a5771e" alt=""><figcaption></figcaption></figure>

## Customizable Views <a href="#h_c670470016" id="h_c670470016"></a>

Haystack allows you to customize your view. We'll go over each section one by one.

<figure><img src="https://downloads.intercomcdn.com/i/o/1015117018/d3d627b565e6d0a4e95bbb16/Screen+Shot+2024-04-08+at+4_14_32+PM.png?expires=1712676259&#x26;signature=5643d3c4ff556d5ddefc2012c5067e78bcc5938d3a8f4cbae201770ba14e9141" alt=""><figcaption></figcaption></figure>

### Update List Layout <a href="#h_a8376d835e" id="h_a8376d835e"></a>

Default layout is list.

<figure><img src="https://downloads.intercomcdn.com/i/o/1021866581/c0f08fda70b4f53496226fd5/Screen+Shot+2024-04-15+at+3_33_48+PM.png" alt=""><figcaption></figcaption></figure>

### Update Board Layout <a href="#h_343ad240c7" id="h_343ad240c7"></a>

You can select board layout to represent a scrum board.

<figure><img src="https://downloads.intercomcdn.com/i/o/1015118312/91a73871bd5ec20f7e5dbcf3/Screen+Shot+2024-04-08+at+4_15_44+PM.png?expires=1712676259&#x26;signature=c0ac0946fbbc0b3c99c0c47d39add4c71f768d60fe8014d0745077cd82620df4" alt=""><figcaption></figcaption></figure>

### Update Columns <a href="#h_82af577d10" id="h_82af577d10"></a>

You can group issues based on

* Status Category (default)
* Status
* Epic
* Assignee
* Issue Type

<figure><img src="https://downloads.intercomcdn.com/i/o/1015121832/7ab8ba17598e49c7f13b8609/Screen+Shot+2024-04-08+at+4_18_09+PM.png?expires=1712676259&#x26;signature=53afe3e9a59dacbca04e25cd756114102c0e385695445ac87c75d81e0ad88458" alt=""><figcaption></figcaption></figure>

### Update Sort Order <a href="#h_52bdfe3993" id="h_52bdfe3993"></a>

You can sort the issues based on

* Last Activity (default)
* Priority
* Match Jira

<figure><img src="https://downloads.intercomcdn.com/i/o/1015124418/04e6a9a962998cbc2211ff64/Screen+Shot+2024-04-08+at+4_20_20+PM.png?expires=1712676259&#x26;signature=d7c7dcfc215e19f38a4ec3d9a6d620d1088f87013650400214ab1f960f28d6a5" alt=""><figcaption></figcaption></figure>

**Note:**

* Match Jira option ensure the order is exact same as in Jira. This settings works for both Board & List layouts.

### Update Display Properties <a href="#h_76af46ad4e" id="h_76af46ad4e"></a>

You can modify the metadata shown in the table.

The available options are

* Issue Type
* Priority
* Assignee
* Storypoints
* Epics
* Subtasks
* Injected Tag
* Labels

{% hint style="info" %}
Property settings will effect metadata shown in preview modals like Last 24 hours.
{% endhint %}

<figure><img src="https://downloads.intercomcdn.com/i/o/1015126866/63eb34fa6bbc2402e5a89cfb/Screen+Shot+2024-04-08+at+4_21_52+PM.png?expires=1712676259&#x26;signature=7967e185a57cec7bce27be2a888b7d929455253c8ee67552b31601c4af5e0ccb" alt=""><figcaption></figcaption></figure>

***

## FAQ <a href="#h_490145d3b5" id="h_490145d3b5"></a>

<details>

<summary>What data is shown in Active Issues page?</summary>

Active issue pages content changes based on your settings.

1. Kanban: Shows all issues in your board based on your settings
2. Sprint: Shows all issues in your sprint based on your settings.

*Note: If an issue is in-progress but not in your sprint, Haystack will not show that issue.*

The settings that effectives what's shown are

1. [Board Settings](https://cdn.zappy.app/3dac4e5ee40fb83f8f7f2e21798e14ed.png)
2. [Sprint Filter](https://cdn.zappy.app/93b090fc40d18bce29b06dc710806d05.png) (only for sprint based boards)
3. [Member Settings](https://cdn.zappy.app/f6a3b7c457c1eea86d54e64e0f303d77.png)
4. [Advanced Board Settings](https://cdn.zappy.app/9db1697d88b8fdd0edb7b034e151f76e.png)

</details>

<details>

<summary>Why do I see a different projects issue in my team?</summary>

Most likely case is you have `Include non-team members work` in [Advanced Board Settings](https://cdn.zappy.app/9db1697d88b8fdd0edb7b034e151f76e.png) as enabled.

This settings ensures the data matches JIRA 100% by ignoring the "Team Member Settings" and showing everyone who contributed to that board.

If you think it doesn't look correct you can disable the setting and check if you still see any problems. If so, you'll need to check all settings that helps calculate what a team setting is.

There are [4 settings](#h_c08135e7d1) that effects a teams data.

</details>

<details>

<summary>Why do I see a different teams issue in my team?</summary>

Most likely case is you have `Include non-team members work` in [Advanced Board Settings](https://cdn.zappy.app/9db1697d88b8fdd0edb7b034e151f76e.png) as enabled.

This settings ensures the data matches JIRA 100% by ignoring the "Team Member Settings" and showing everyone who contributed to that board.

If you think it doesn't look correct you can disable the setting and check if you still see any problems. If so, you'll need to check all settings that helps calculate what a team setting is.

There are [4 settings](#h_c08135e7d1) that effects a teams data.

</details>

<details>

<summary>How does Haystack know if a Pull Request is linked to an Issue?</summary>

Haystack links Pull Requests to Issues by using [JIRA's referrence issue document](https://support.atlassian.com/jira-software-cloud/docs/reference-issues-in-your-development-work/).

</details>

<details>

<summary>How can I check which Pull Requests are linked to my issue?</summary>

You can [click on any issue](https://cdn.zappy.app/2f166f90d3925d416055c64a7b4ce9bd.png) to see the Pull Requests clicked to them.

</details>

<details>

<summary>How can I check which Pull Requests are not linked to any issue?</summary>

You can check this via creating a [new report](https://cdn.zappy.app/ff297358ed8aa64ba563da69012508a6.png) with the metric `PRs unlinked`.

If you click on any point in the graph, it'll show you the whole list of unlinked Pull Requests in the given segment.

</details>


# Pull Requests

See pull requests that are in progress

This blog will go over how to use [Pull Requests](https://delivery.usehaystack.io/team/pull-requests) page in Haystack.

<figure><img src="https://downloads.intercomcdn.com/i/o/1021888877/1e12a4368aa76ae21e4bb9f3/Screen+Shot+2024-04-15+at+3_50_20+PM.png" alt=""><figcaption></figcaption></figure>

## Recent Activity <a href="#h_5c868a5c33" id="h_5c868a5c33"></a>

### Activity Bubbles <a href="#h_0e1b68b8dd" id="h_0e1b68b8dd"></a>

Haystack combines all commits, comments, approvals as a activity bubble in the progress bar. The more activities there are, the bigger the bubble is.

You can hover each bubble to see the corresponding activity.

The blue line starts from first activity "opened pr" all the way to PR getting merged or closed.

<figure><img src="https://downloads.intercomcdn.com/i/o/1016261818/40905f7a56367b47928e904c/Screen+Shot+2024-04-09+at+3_47_57+PM.png?expires=1712675361&#x26;signature=bd49234cd8d9f4c94e23407ad82db87109a760dca0766e2c47c222239fcca146" alt=""><figcaption></figcaption></figure>

### Time in Review <a href="#h_ab1703a5d4" id="h_ab1703a5d4"></a>

Time in status shows how long it has been in that state. There are 3 states a Pull Request can be in

* **Draft**: PR is in draft state
* **Review required**: PR is open & not approved
* **Approved**: PR has at least one approval

<figure><img src="https://downloads.intercomcdn.com/i/o/1016256413/477f1a93a4cb534d5e5efa45/Screen+Shot+2024-04-09+at+3_44_12+PM.png?expires=1712675361&#x26;signature=ebf49a8ac794ccaf91c6f8b4b092a425f4c79b756c24b4b50e7a791b099404d6" alt=""><figcaption></figcaption></figure>

### Member Filters <a href="#h_fccfd13fbf" id="h_fccfd13fbf"></a>

Member filter allows you to see all the issues in that cycle.

<figure><img src="https://downloads.intercomcdn.com/i/o/1016253874/7e65753612764db31a24d835/Screen+Shot+2024-04-09+at+3_42_24+PM.png?expires=1712675361&#x26;signature=eefca8db5938a69dd6cc109a95798454e164286fecef76f3403cf3ec49947cae" alt=""><figcaption></figcaption></figure>

## Risks <a href="#h_7200a8226a" id="h_7200a8226a"></a>

### Active Risks <a href="#h_2233b21f39" id="h_2233b21f39"></a>

You can see the active risk on the right side panel.

Clicking on it will filter the PRs with that specific risk.

<figure><img src="https://downloads.intercomcdn.com/i/o/1016289254/940df3be246c96459f5e13be/Screen+Shot+2024-04-09+at+4_06_38+PM.png?expires=1712675361&#x26;signature=e643e46ef3a0a09caf2f38348c3bea3e5e4313abc601b089577bc58a36c74090" alt=""><figcaption></figcaption></figure>

### Update Risks <a href="#h_3113b35387" id="h_3113b35387"></a>

You can configure risks by visiting [PR Risks Settings page](https://delivery.usehaystack.io/team/settings/risks/pull-requests).

<figure><img src="https://downloads.intercomcdn.com/i/o/1016274533/63e2f8116a209a7851718cb6/Screen+Shot+2024-04-09+at+3_56_31+PM.png?expires=1712675361&#x26;signature=11ed04a8ac425076a258a4214ae1e57dcba2071ba550d7c780d0a4c837ae02c6" alt=""><figcaption></figcaption></figure>

There are 6 risks that can be configured. Each configuration can mark a PR if it fits it's conditions.

* **High Review Time**: Marked when time since PR opened above given threshold. Time in Draft state does not count for Review Time.
* **No Activity**: Marked when PR hasn't had any activity above given threshold. An activity is anything from commit, comments, approvals, description changes, requesting review and so on.
* **No Reviewer**: Mark when PR has 0 reviewers requested.
* **Large Pull Request**: Marked when PR Line Changes is above given threshold. Line change count is the sum of additions & removals of lines..
* **Stuck in Discussion**: Marked when PR has comments above given threshold.
* **Not Linked to Jira Issue**: Marked when PR is not linked to a Jira issue. Haystack uses [JIRA's referrence issue document](https://support.atlassian.com/jira-software-cloud/docs/reference-issues-in-your-development-work/) to mark if a PR is linked or not.

{% hint style="info" %}
You can set slack alerts [Not Linked to Jira Issue](https://cdn.zappy.app/8f67967da513a74312608feb244690a4.png) via [Team Alerts Settings page](https://delivery.usehaystack.io/team/settings/alerts)
{% endhint %}

## Customizable Views <a href="#h_f3743ad48c" id="h_f3743ad48c"></a>

Haystack allows you to customize your view. We'll go over each section one by one.

<figure><img src="https://downloads.intercomcdn.com/i/o/1016297055/3a7e2869b79079b7d644df6c/Screen+Shot+2024-04-09+at+4_12_00+PM.png?expires=1712675361&#x26;signature=d4c1fe77ef66ede2908e30d42cf7fff9f06f06500dc5a8a9e0fe76b738c81adb" alt=""><figcaption></figcaption></figure>

### Update Columns <a href="#h_a84a892de1" id="h_a84a892de1"></a>

You can group Pull Requests based on

* Status (default)
* Risks
* Author
* Reviewer
* Labels
* Repository
* Issues
* None

<figure><img src="https://downloads.intercomcdn.com/i/o/1016296360/9d0cbaa33030dff97136ce49/Screen+Shot+2024-04-09+at+4_11_27+PM.png?expires=1712675361&#x26;signature=e5980faf467404258a7759f5326712dc2407b926b5a4fd65d3b34dad7358cfdd" alt=""><figcaption></figcaption></figure>

### Update Sort Order <a href="#h_341b18de90" id="h_341b18de90"></a>

You can sort the issues based on

* Last updated (default)
* Opened at
* Comments
* Line Changes

### Hidden PRs <a href="#h_72d312d97d" id="h_72d312d97d"></a>

You can hide any pr that you don't want to see in this page.

<figure><img src="https://downloads.intercomcdn.com/i/o/1016306776/23282394347ff41fd286656c/Screen+Shot+2024-04-09+at+4_19_18+PM.png?expires=1712675361&#x26;signature=59826e25a5691a7b59e727d12f8217922b4ca80ab723e745a006af531a546dd3" alt=""><figcaption></figcaption></figure>

You can see hidden PRs by toggling the `Show hidden PRs` button.

<figure><img src="https://downloads.intercomcdn.com/i/o/1016306298/a9bcb208c6e5602769788094/Screen+Shot+2024-04-09+at+4_18_57+PM.png?expires=1712675361&#x26;signature=390f2ff0618c9c0e7fce7d17aeba848afb9077479e63eb97ca4edc411edb7a65" alt=""><figcaption></figcaption></figure>

**Note**: Showing & hiding works individually for each team. If you hide a PR from one team, it will still continue to show in another team unless it's marked hidden from their as well.

***

## FAQ <a href="#h_9482070bbc" id="h_9482070bbc"></a>

### Does Pull Requests page show merged PRs? <a href="#h_600d674432" id="h_600d674432"></a>

No, only open Pull Requests are shown in this page. Once a Pull Request is merged or closed, they will disappear.

### Whose work does Pull Requests page show? <a href="#h_947d37ff15" id="h_947d37ff15"></a>

The following settings have effect on what is being shown in Pull Request page.

* [Team Member Settings](https://cdn.zappy.app/f6a3b7c457c1eea86d54e64e0f303d77.png): All PRs that were made by your members will be shown.
* ["Include non-team members work" Setting](https://cdn.zappy.app/c0bcdaef04f87197f64f955e721c0de2.png): All PRs that have corresponding issue in that board will be shown regardless if the member is tagged as part of your team or not.

You can configure this [Team Member Settings](https://delivery.usehaystack.io/team/settings/members) page.

### Can I send Pull Request Alerts to Slack? <a href="#h_17572a2e11" id="h_17572a2e11"></a>

Haystack only supports [Not Linked to Jira Issue](https://cdn.zappy.app/8f67967da513a74312608feb244690a4.png) via [Team Alerts Settings page](https://delivery.usehaystack.io/team/settings/alerts).

Other PR Risks do have Slack alerts supported.

### How does Haystack know if a Pull Request is linked to an Issue? <a href="#h_d526b5f34f" id="h_d526b5f34f"></a>

Haystack links Pull Requests to Issues by using [JIRA's referrence issue document](https://support.atlassian.com/jira-software-cloud/docs/reference-issues-in-your-development-work/).

### How can I check which Pull Requests are not linked to any issue? <a href="#h_c706a23f55" id="h_c706a23f55"></a>

You can check this 2 ways

1. Creating a [new report](https://cdn.zappy.app/ff297358ed8aa64ba563da69012508a6.png) with the metric `PRs unlinked`.
   1. If you click on any point in the graph, it'll show you the whole list of unlinked Pull Requests in the given segment.
2. Filtering [Not Linked to Jira Issue](#h_7200a8226a)[ ](/features/pull-requests)risk.

<br>


# Epics

See epics that are in progress

{% hint style="warning" %}
This feature is in `beta`\
​\
We’re actively working to improve this feature and we could use your help!

If you have questions, feedback, or requests please message us in Slack or email <support@usehaystack.io>.
{% endhint %}

This article will explain how [Epic page](https://delivery.usehaystack.io/team/epics) works.

<figure><img src="https://downloads.intercomcdn.com/i/o/1015286525/a2cdf373b0d50409d02c6041/Screen+Shot+2024-04-08+at+6_23_51+PM.png?expires=1712595989&#x26;signature=a1545dd1ca5809e0a69a3692d4ee8c1a56ad800db64bbfc6efbdbf89b9de135b" alt=""><figcaption></figcaption></figure>

## Active Epics <a href="#h_ed18a904a7" id="h_ed18a904a7"></a>

When you open the page you can see active epics by default

<figure><img src="https://downloads.intercomcdn.com/i/o/1021885200/00f5c8b9977d88fc0952f63f/Screen+Shot+2024-04-15+at+3_47_34+PM.png" alt=""><figcaption></figcaption></figure>

## Inactive Epics <a href="#h_8ca25f0b89" id="h_8ca25f0b89"></a>

`No worked in last {timeframe}` dropdown allows you to see all other epics inside your teams board.

Changing the timeframe will impact which epics belongs to the *active epics section* vs *inactive epics sections.*

<figure><img src="https://downloads.intercomcdn.com/i/o/1015297029/c998e9ee4bce4d2060461c29/Screen+Shot+2024-04-08+at+6_31_41+PM.png?expires=1712595989&#x26;signature=dcb3756ec6cfa1dd024f51f849c07e9a41ae2c0a0c07903d0b4993727dc0a610" alt=""><figcaption></figcaption></figure>

## Progress Percentages <a href="#h_b9577475bd" id="h_b9577475bd"></a>

For each epic you will see 2 percentages

* **Last 30 days**: Depending on the [timeframe](/features/epics)[ ](#h_cb615a49a5)you selected, will show how much of the issues inside the epic has been moved to `done` status category. The title will also change accordingly
* **In total:** Shows how much of the issues inside the epic has been moved to `done` status category.

<figure><img src="https://downloads.intercomcdn.com/i/o/1021880109/ce2b3591192d4e00049ea828/Screen+Shot+2024-04-15+at+3_43_40+PM.png" alt=""><figcaption></figcaption></figure>

**Note:**

* The %'s will include all issues, not just the issues completed by your team. You can [see which issues where contributed by whom](https://cdn.zappy.app/edbf865a0ddbfbb885612b729fa52f65.png) by [drilling down](#h_d1f8e5b06b).

## Issues inside Epic <a href="#h_d1f8e5b06b" id="h_d1f8e5b06b"></a>

You can click the bars and see what's

* **Blue**: Completed "before" this time frame
* **Green**: Completed "during" this time frame
* **Gray**: Not completed

<figure><img src="https://haystack-cf20ab244ac6.intercom-attachments-1.com/i/o/1015302895/de119184fa7b11bdfcc18487/2f6038d6f549a28d64f0d73d9e31282d.gif?expires=1712595989&#x26;signature=62df02f8479549c3705b57443f19619e19e7728757c1e5528f62b4686bd10c6c" alt=""><figcaption></figcaption></figure>

**Note**:

* You can [update the metadata](https://cdn.zappy.app/295f8376b4bbffd85a6bbe89107f2b53.png) shown inside the modal by clicking the view dropdown
* If multiple teams have contributed to the epic, you can [see which issues where contributed by whom](https://cdn.zappy.app/edbf865a0ddbfbb885612b729fa52f65.png)

## Date Filter <a href="#h_cb615a49a5" id="h_cb615a49a5"></a>

You can select different timeframes.

The following options are available.

* Last 7 days
* Last 30 days
* This week
* This month
* This quarter

<figure><img src="https://haystack-cf20ab244ac6.intercom-attachments-1.com/i/o/1015302868/2a1bf0a01ff74e45cca0b890/50725fc38de717f8af0580888fc1e3ab.png?expires=1712595989&#x26;signature=d2d424c5c37f17dafdba729be2542deaef10e2599c57968ba3f527491f68d476" alt=""><figcaption></figcaption></figure>

***

## FAQ <a href="#h_73f3bbcadb" id="h_73f3bbcadb"></a>

### What epics are shown? <a href="#h_5b12d4a486" id="h_5b12d4a486"></a>

The epics are shown based on [team board setting](https://cdn.zappy.app/77cc8f753e562b0bd99ecc4d90668cf6.png).

Haystack gets all the epics in your board ([timeline in Jira](https://cdn.zappy.app/29e013f8de64d8b2efb4687c62cbfc2d.png)). Team member filters do not have impact on the epics being shown. However, team members will have impact on the drill-ins [to see which issues where contributed by which team](https://cdn.zappy.app/edbf865a0ddbfbb885612b729fa52f65.png).


# Retrospective

Learn how to use the retrospective page

This blog will go over how to use [Retros](https://delivery.usehaystack.io/team/retrospective) page in Haystack.

<figure><img src="https://downloads.intercomcdn.com/i/o/1016349438/ca85aa0712e35bba5a736a4a/Screen+Shot+2024-04-09+at+4_49_52+PM.png" alt=""><figcaption></figcaption></figure>

## Multiple Sprints / Weeks <a href="#h_3a442a572a" id="h_3a442a572a"></a>

*Note: Retrospective page has different views for Kanban & Sprints boards. The Kanban version will be a trimmed down version of the Sprint one.*

### Completion Rate <a href="#h_644d874c5f" id="h_644d874c5f"></a>

{% hint style="info" %}
Only available in Sprint teams.
{% endhint %}

Completion Rate metric changes based on[ Issues vs Points setting](#h_cd813559c8).

* **Issues Calculation**: `Issues Completed in Sprint / Total Issues in Sprint`
  * **Issues Completed in Sprint**: In the end of a sprint, any issue that is still part of sprint and has Status Category as `Done`
  * **Total Issues in Sprint**: In the end of a sprint, any issue that is still part of sprint.
* **Points Calculation**: `Story Points Completed in Sprint / Total Story Points in Sprint`
  * **Points Completed in Sprint**: In the end of a sprint, any issue that is still part of sprint and has Status Category as `Done` .
  * **Total Points in Sprint**: In the end of a sprint, any issue that is still part of sprint.

<figure><img src="https://downloads.intercomcdn.com/i/o/1016350248/f91af49acb750bd426008650/Screen+Shot+2024-04-09+at+4_50_31+PM.png" alt=""><figcaption></figcaption></figure>

***Note:***

* You can check every issue that was included in the calculation by [drilling inside specific Sprint/Week Reports.](#h_b24df9c819)
* For "Points Calculations" if an issue does not have story points attached to it, it is simply counted as 0.
* Haystack uses Status Category to standardized Completion Rate across different teams
* You can read more about [What is Status Category?](/faq/what-is-status-category)

### Issues Completed <a href="#h_4338c3aeae" id="h_4338c3aeae"></a>

{% hint style="info" %}
Available for both Kanban & Sprint teams.
{% endhint %}

Issue Completed metric changes based on [Issues vs Points setting](https://help.usehaystack.io/en/articles/9174347-retrospective#h_970f635696)[.](#h_cd813559c8)

* **Issues Calculation**: `Issues Completed in Sprint/Week`
  * **Issues Completed in Sprint/Week**: In the end of a sprint/week, any issue that is still part of sprint/week and has Status Category as `Done`
* **Points Calculation**: `Story Points Completed in Sprint/Week`
  * **Points Completed in Sprint/Week**: In the end of a sprint/week, any issue that is still part of sprint/week and has Status Category as `Done` .

<figure><img src="https://downloads.intercomcdn.com/i/o/1016386212/a81fa9f9866ff1afac49c936/Screen+Shot+2024-04-09+at+5_17_07+PM.png" alt=""><figcaption></figcaption></figure>

***Note:***

* You can check every issue that was included in the calculation by [drilling inside specific Sprint/Week Reports.](#h_b24df9c819)
* For "Points Calculations" if an issue does not have story points attached to it, it is simply counted as 0.
* Haystack uses Status Category to standardized Completion Rate across different teams
* You can read more about [What is Status Category?](/faq/what-is-status-category)
* For Kanban teams it's end of week, for Sprint teams it's end of Sprint

### Scope Change <a href="#h_ea038e84a1" id="h_ea038e84a1"></a>

{% hint style="info" %}
Only available in Sprint teams.
{% endhint %}

Scope Change metric changes based on [Issues vs Points setting](https://help.usehaystack.io/en/articles/9174347-retrospective#h_970f635696)[.](#h_cd813559c8)

* **Issues Calculation**: `# of Issues Start of Sprint - # of Issues End of Sprint`
* **Points Calculation**: `# of Story Points Start of Sprint - # of Story Points End of Sprint`

<figure><img src="https://downloads.intercomcdn.com/i/o/1016373769/306f461389b164e36a25fa25/Screen+Shot+2024-04-09+at+5_07_40+PM.png" alt=""><figcaption></figcaption></figure>

***Note:***

* You can check every issue that was included in the calculation by [drilling inside specific Sprint/Week Reports.](#h_b24df9c819)
* Statuses of an issue does not effect the metric. As long as the issue is in sprint it will be counted.
* For "Points Calculations" if an issue does not have story points attached to it, it is simply counted as 0.

### Investments <a href="#h_e1bf47e112" id="h_e1bf47e112"></a>

{% hint style="info" %}
Available for both Kanban & Sprint teams.
{% endhint %}

Investments metric changes based on [Issues vs Points setting](https://help.usehaystack.io/en/articles/9174347-retrospective#h_970f635696)[.](#h_cd813559c8)

* **Issues Calculation**: `Issues Completed in sprint/week tagged as given investment`
  * **Issues in sprint tagged as given investment**: In the end of a sprint, any issue that is still part of sprint and has Status Category as `Done` & tagged as given Investment
* **Points Calculation**: `Story Points in sprint/week tagged as given investment`
  * **Story Points in sprint tagged as given investment**: In the end of a sprint, any issue that is still part of sprint and has Status Category as `Done` & tagged as given Investment

<figure><img src="https://downloads.intercomcdn.com/i/o/1016388528/81956b2f03faad511c728c2e/Screen+Shot+2024-04-09+at+5_19_11+PM.png" alt=""><figcaption></figcaption></figure>

{% hint style="info" %}
Learn how to [setup Investment Categories](#h_54589b839b)
{% endhint %}

*Note:*

* You can check every issue that was included in the calculation by [drilling inside specific Sprint/Week Reports.](#h_b24df9c819)
* For "Points Calculations" if an issue does not have story points attached to it, it is simply ignored.
* Haystack uses Status Category to standardized Completion Rate across different teams
* You can read more about [What is Status Category?](/faq/what-is-status-category)
* For Kanban teams it's end of week, for Sprint teams it's end of Sprint

## Single Sprint / Week <a href="#h_b24df9c819" id="h_b24df9c819"></a>

You can click on any week/sprint and drill-in into that specific report.

You can check more about Retros Report

<figure><img src="https://downloads.intercomcdn.com/i/o/1016407653/5bea7e68fff234b7d416e6d2/Screen+Shot+2024-04-09+at+5_34_10+PM.png" alt=""><figcaption></figcaption></figure>

### Sprint Goals <a href="#h_c48aef1151" id="h_c48aef1151"></a>

In Jira you can set [sprint goals](https://cdn.zappy.app/ed295ae6dc30f1b4c39e787b983f5806.png). You can see the goals set in Jira inside Haystack.

<figure><img src="https://downloads.intercomcdn.com/i/o/1016435917/1b2e6573090cae42655d12e2/Screen+Shot+2024-04-09+at+5_56_50+PM.png" alt=""><figcaption></figcaption></figure>

### Completion Rate <a href="#h_2ab3ef177a" id="h_2ab3ef177a"></a>

{% hint style="info" %}
Only available in Sprint teams.
{% endhint %}

Read more on [How is Completion Rate Calculated?](#h_2ab3ef177a)

Clicking on "See details" button will show a [modal](https://cdn.zappy.app/df453f24d8ba413fe84c0128d7dce6c6.png) with every issue that Haystack used to calculated this metric.

<figure><img src="https://downloads.intercomcdn.com/i/o/1016419971/bef126f40044c0c90b6cbd5e/Screen+Shot+2024-04-09+at+5_44_04+PM.png" alt=""><figcaption></figcaption></figure>

### Planned vs. Injected <a href="#h_5970b5143a" id="h_5970b5143a"></a>

{% hint style="info" %}
Only available in Sprint teams.
{% endhint %}

* **Committed Issue**: Any issue that was inside the sprint before the sprint started.
* **Injected Issue**: Any issue that was added to the sprint after the sprint started.

Issue Completed metric changes based on [Issues vs Points setting](/features/retrospective)[.](#h_cd813559c8)

* **Issues Calculation**: Issues that are tagged as commited or injected
* **Points Calculation**: Points of Issues that are tagged as commited or injected

Clicking on "See details" button will show a [modal](https://cdn.zappy.app/66cc81368bdb369fa82845ae2fc80b19.png) with every issue that Haystack used to calculated this metric.

<figure><img src="https://downloads.intercomcdn.com/i/o/1016425171/8daa207fde166c6aa3fe5c71/Screen+Shot+2024-04-09+at+5_48_28+PM.png" alt=""><figcaption></figcaption></figure>

**Note:**

* To handle edge cases, after a sprint has started, if any issue has been added to the sprint with-in a 10 minute period, Haystack considered them as "Committed Issues". After this grace period ends, all issues added the to sprint will be counted as "Injected Issue"
* For "Points Calculations" if an issue does not have story points attached to it, it is simply counted as 0.

### Investment Categories <a href="#h_54589b839b" id="h_54589b839b"></a>

{% hint style="info" %}
Available for both Kanban & Sprint teams.
{% endhint %}

Read more on [How is Investments are Calculated?](#h_e1bf47e112)

Clicking on "See details" button will show a [modal](https://cdn.zappy.app/cdd01e9f0400b8dad76b4fb0116cfbe9.png) with every issue that Haystack used to calculated this metric.

{% hint style="info" %}
Learn how to [setup Investment Categories](/setup/organization/investments)
{% endhint %}

<figure><img src="https://downloads.intercomcdn.com/i/o/1016435423/a0d0bdf475d2667ea2d8dc57/Screen+Shot+2024-04-09+at+5_56_27+PM.png" alt=""><figcaption></figcaption></figure>

### Epic Progress <a href="#h_78ca46d76f" id="h_78ca46d76f"></a>

{% hint style="info" %}
Available for both Kanban & Sprint teams.
{% endhint %}

The bar for each epic shows

* **Blue**: % of issues completed outside of sprint
* **Green**: % of issues completed during of sprint
* **Gray**: % of issues not completed

Clicking on "See details" button will show a [modal](https://cdn.zappy.app/9341080fabb76ccd5f2e20e93f069212.png) with every issue that Haystack used to calculated this metric.

Read more on [How is Epic Progress is Calculated?](/features/epics)

{% hint style="info" %}
See [epics page](/features/epics) for a broader view
{% endhint %}

<figure><img src="https://downloads.intercomcdn.com/i/o/1016441210/dffa1c91b1bba27bd973e25f/Screen+Shot+2024-04-09+at+6_01_09+PM.png" alt=""><figcaption></figcaption></figure>

### Release Notes <a href="#h_46db9ae9d6" id="h_46db9ae9d6"></a>

{% hint style="info" %}
Available for both Kanban & Sprint teams.
{% endhint %}

Opens Release notes for that sprint.

{% hint style="info" %}
See [release notes](/features/release-notes) for a broader view
{% endhint %}

<figure><img src="https://downloads.intercomcdn.com/i/o/1016446073/fbbf1d9c658f8063f6914626/Screen+Shot+2024-04-09+at+6_05_23+PM.png" alt=""><figcaption></figcaption></figure>

## Customizable Views <a href="#h_2db1f329f1" id="h_2db1f329f1"></a>

### Issues vs. Story Points <a href="#h_cd813559c8" id="h_cd813559c8"></a>

You can change all calculations to

* Issues
* Points

where Points represent `Story Points` field in JIRA.

<figure><img src="https://downloads.intercomcdn.com/i/o/1016402420/1d1c039c7b0bc40381cb0bf8/Screen+Shot+2024-04-09+at+5_30_01+PM.png" alt=""><figcaption></figcaption></figure>

The setting will effect on the following metrics

* [Completion Rate](#h_644d874c5f)
* [Issues Completed](#h_4338c3aeae)
* [Scope Change](#h_ea038e84a1)
* [Investments](#h_e1bf47e112)

## Sharing & Export <a href="#h_c571fda660" id="h_c571fda660"></a>

### Export as CSV <a href="#h_f0b044d053" id="h_f0b044d053"></a>

You can export Retro Report in CSV format using the Export button.

<figure><img src="https://downloads.intercomcdn.com/i/o/1016400453/3803de7c971f718765c9b483/Screen+Shot+2024-04-09+at+5_28_37+PM.png" alt=""><figcaption></figcaption></figure>

### Export as Image <a href="#h_0a8637b00c" id="h_0a8637b00c"></a>

You can export Retro Report Drill-in page in PNG format using the Export button.

<figure><img src="https://downloads.intercomcdn.com/i/o/1016450874/a907671d002470506c5ad3d5/Screen+Shot+2024-04-09+at+6_09_37+PM.png" alt=""><figcaption></figcaption></figure>

### Share via URL <a href="#h_041d785e2a" id="h_041d785e2a"></a>

You can export any page in Haystack, including Retrospective pages just by sharing the URL. The URL will have the team & the week/sprint information allowing you to easily share with other teammates.\
​\
​Example: `https://delivery.usehaystack.io/team/{teamId}/review/{reportId}`

***

## FAQ <a href="#h_5b98aac6dd" id="h_5b98aac6dd"></a>

<details>

<summary> Why is first row in Retros page tagged as active?</summary>

&#x20;The [first row](https://cdn.zappy.app/c87ef95a8922bdea013234d7cd35d2a5.png) in Retros page is the only week/sprint that is not completed, thus any number you see there can change during the week.

* Sprint teams, once you complete the sprint
* Kanban teams, once it's Monday

The report will stop being as active and the tag will be removed. Any number you see will freeze unless you change [configurations that effects the page](#h_d7a2e62e6a).

</details>

<details>

<summary>Can Retrospective page numbers change?</summary>

Except for the [first row](#h_4590049b74), all numbers are static.

Once the sprint/week is complete the number will not change except for any update Team Settings.

Update in the following settings will change historical data

1. Retrospective page settings
   1. [Issue vs Story Points](#h_cd813559c8)
2. [Team settings](https://delivery.usehaystack.io/team/settings)
   1. Jira board
   2. Filter Sprints
   3. Members
   4. Show member's work outside of the board
   5. Include non-team members work

</details>

<details>

<summary>How is sprint completion calculated?</summary>

You can read how Sprint Completion Rate is calculated [here](#h_644d874c5f)[.](#h_87798c72d7)

</details>

<details>

<summary>Can I update the sprint completion calculation?</summary>

No. Sprint Completion metric is pre-defined. It cannot be configured.

</details>

<details>

<summary>Can I use issues instead of story points (or visa versa)?</summary>

Yes, you can switch between story points & issues. You can read more [here](#h_cd813559c8).

</details>

<details>

<summary>Can I use JIRA's original time estimate field?</summary>

No. Haystack only supports issues & storypoints. You can read more [here](#h_cd813559c8).

</details>

<details>

<summary>What is Injected Issue?</summary>

There are 2 terms you need to be aware of

* **Committed Issue:** Any issue that was inside the sprint before the sprint started.
* **Injected Issue:** Any issue that was added to the sprint after the sprint started.

**Note**: To handle edge cases, after a sprint has started, if any issue has been added to the sprint with-in a 10 minute period, Haystack considered them as "Committed Issues". After this grace period ends, all issues added the to sprint will be counted as "Injected Issue"

You can read more [here](#h_5970b5143a).

</details>

<details>

<summary>What happens when removing tickets from a sprint?</summary>

A ticket can only be removed from a sprint only during the sprint.

This would effect any metric from scope/completion rate/issue completed etc. for that sprint. Once the sprint is completed, the metrics will freeze.  \
\
For more info read [Retrospective](/features/retrospective#h_d7a2e62e6a)

</details>


# Release Notes

Get a human-readable summary of what the team completed recently and share it with stakeholders.

## Overview

Release Notes is an AI-powered feature that compiles all your completed work and generates a concise summary. This is particularly useful for sharing updates with stakeholders via Slack.

## Basics <a href="#h_75fbf410f3" id="h_75fbf410f3"></a>

### Generation

Haystack leverages issue metadata like titles, descriptions, and parent tasks to generate release notes.

### Timeframes <a href="#h_360d2bd2d5" id="h_360d2bd2d5"></a>

Haystack generates release notes for Scrum teams per sprint and for Kanban teams per week.

### Categories <a href="#h_902f7f4438" id="h_902f7f4438"></a>

Release notes categorize your work into three buckets: Features, Bugs, and Other.

### Underlying issues <a href="#h_74887530e9" id="h_74887530e9"></a>

Each Release Notes bullet point contains a link to view underlying issues.

<figure><img src="/files/p4Z6C4jE0btg0wFGIz9v" alt=""><figcaption><p>See underlying issues of each Release Notes bullet point</p></figcaption></figure>

### Share in Slack <a href="#h_74326cd73b" id="h_74326cd73b"></a>

To automatically share release notes to a Slack channel, click "Send automatic updates" and select the desired channel.

<figure><img src="/files/5YYlOdHtbsY3bYgOwhpw" alt=""><figcaption><p>Send Release notes automatically in Slack</p></figcaption></figure>

Release notes will be sent automatically at the end of each sprint (for Scrum teams) and at the beginning of the following week (for Kanban teams). Example Slack alert:

<figure><img src="/files/8bpiX9vI6UwL2K8CRYct" alt=""><figcaption><p>Slack Release Notes are designed to credit engineers who completed tasks by tagging them</p></figcaption></figure>

### Copy text <a href="#h_0c4a2f2298" id="h_0c4a2f2298"></a>

To add Release Notes to other tools, copy the content to your clipboard by clicking "Copy text" near the Release Notes title.

<figure><img src="/files/oz18Ge73KEJFIp8yATkS" alt=""><figcaption><p>Copy and Paste you release notes to other tools</p></figcaption></figure>

### Share via URL <a href="#h_e179cab759" id="h_e179cab759"></a>

You can share the page URL with other Haystack users to access the exact Release Notes. Non-Haystack users can be invited to the platform at no extra charge.

### Custom Release Notes <a href="#h_96276df186" id="h_96276df186"></a>

To create a summary for larger timeframes, select "Custom release notes" from the top right menu.

<figure><img src="/files/ws2tsTjVx563C6m9G7BZ" alt=""><figcaption><p>Custom Release Notes</p></figcaption></figure>

#### Select date range

You can select dates up to 6 months in the past. All selected days start at 00:00 and end at 23:59 GMT.

#### Select group by

1. Auto (Features/Bugs/Other)
2. By epic

#### Configure

Once you select your configurations, click "Generate". Generating release notes may take some time depending on your data size. You can leave the page and return later; your release notes will be available in the dashboard once generated.

***

## FAQ <a href="#h_efd255d526" id="h_efd255d526"></a>

<details>

<summary>How are release notes generated?</summary>

Haystack uses GPT-4 to summarize all Jira issues moved to “Done” during the selected timeframe.

</details>

<details>

<summary>What data is used to generate release notes?</summary>

Haystack uses your definition of done based on the team’s project board. Every board defines it’s own statuses, each status mapped to a category (To Do, In Progress, Done). Haystack considers issues in the “Done” category to be released.

</details>

<details>

<summary>Do you have release notes for multiple teams?</summary>

No, release notes are currently supported for a single team. if you’d like to create multi-team release notes we suggest sending release notes to a shared #releases slack channel to collect release notes for each team

</details>

<details>

<summary>Can I re-generate release notes?</summary>

No, release notes are cached after they have been generated. If you’d like to re-generate release notes, message us at <support@usehaystack.io>

</details>


# Investments

Understand where effort was spent. Know exactly what your feature capacity is.&#x20;

{% hint style="info" %}
For more info check [Investments](/setup/organization/investments) page.&#x20;
{% endhint %}


# Alerts

We'll go over each alert Haystack has.&#x20;

<figure><img src="/files/11RUUUsBhlmGjaSJDTDf" alt=""><figcaption></figcaption></figure>

{% hint style="info" %}
Check how to setup [Alerts](/setup/teams/alerts)
{% endhint %}

## Risks

### Issue Stuck

**Triggers:** When an issue passes it's [stuck configs](/setup/teams/risks).

<figure><img src="/files/uG5bilgNmhjJTOeiB7qZ" alt=""><figcaption></figcaption></figure>

### Bug SLA Risk

**Triggers:** When a bug passes it's [at risk configs](/setup/teams/slas).

<figure><img src="/files/uJxZsg7k2aS0wwL3uIeP" alt=""><figcaption></figcaption></figure>

### Bug SLA Broken

**Triggers:** When a bug passes it's [broken configs](/setup/teams/slas).

<figure><img src="/files/KsE1yp4GuY6kbLzhvJlz" alt=""><figcaption></figcaption></figure>

### PR Not Linked

**Triggers:** When PR doesn't have a [link to an issue](/features/issues#h_99088c5f36). Haystack has a 10 minute delay before sending the alert.

<figure><img src="/files/dsR2frlzHGCd0oXOlRgv" alt=""><figcaption></figcaption></figure>

### Sprint Overcapacity

**Triggers:** When issue count or storypoint count passes [capactiy limit](/setup/teams/capacity). Haystack has a 30 minute delay before sending the alert.

<figure><img src="/files/r9oti1mD8X8PnYTOD552" alt=""><figcaption></figcaption></figure>

## Progress & Achievements

### Mid-sprint Review

**Triggers:** When \~50% of time passed between sprint start date & sprint end date.

<figure><img src="/files/SgfNN8jeY2AOu3iQKjKY" alt=""><figcaption></figcaption></figure>

### Cycle Completed

For Sprint & Kanban teams we have 2 different alerts

**Triggers:**&#x20;

* For Kanban, Monday 9AM (organizations default timezone)
* For Sprint, when sprint is tagged as completed

<figure><img src="/files/B5j13EGcAi2O8NqpjKk4" alt=""><figcaption></figcaption></figure>

<figure><img src="/files/CKtzQccYVnvOVIw9FVKZ" alt=""><figcaption></figcaption></figure>

### Release Notes

For Sprint & Kanban teams we have 2 different alerts

**Triggers:**&#x20;

* For Kanban, Monday 9AM (organizations default timezone)
* For Sprint, when sprint is tagged as completed

<figure><img src="/files/7HSFR1WX6Wl7OjhgnY6o" alt=""><figcaption></figcaption></figure>

<figure><img src="/files/E6CBxfXfZohz034k4NWZ" alt=""><figcaption></figcaption></figure>

### Epic Completion

**Triggers:** All issues under an epic is moved to Done status category

<figure><img src="/files/zt94hF9aEmK1g3ceLOi7" alt=""><figcaption></figcaption></figure>


# Customizable Widgets

Learn how to create a new widgets

In this article we'll go over details on how to create a Widget.

There are 2 places you can add Reports

* [Team metrics](https://delivery.usehaystack.io/team/metrics) (check Learn how to use Team metrics article)
* [Reports](https://delivery.usehaystack.io/reports) (check Learn how to use Reports article)

Below are all the ways you can create a new report.

<figure><img src="https://downloads.intercomcdn.com/i/o/1018296748/65d4769091c83497658f0e22/Screen+Shot+2024-04-11+at+11_16_53+AM.png" alt=""><figcaption></figcaption></figure>

{% hint style="info" %}
Read more on [Team Reports](/features/team-metrics) & [Flexible Reports](/features/flexible-reports)
{% endhint %}

## Report Widget <a href="#h_bd03ca526c" id="h_bd03ca526c"></a>

A report consists of 2 high level parts

* Data
* Visualization

We'll go each of below.

### Select metric <a href="#h_702f947474" id="h_702f947474"></a>

Metric section is the basis of any graph.

There are 4 types of entities

* Sprint
* Issue
* Pull Request
* Deployments

Based on which time of entity you selected, all the options underneath from calculation method to filter options will change.

<figure><img src="https://downloads.intercomcdn.com/i/o/1018300476/9a73437908d4a2675af18e71/Screen+Shot+2024-04-11+at+11_21_13+AM.png" alt=""><figcaption></figcaption></figure>

{% hint style="info" %}
To see every metric in detail check [all metrics](/features/list-of-all-metrics).
{% endhint %}

### Select calculation method <a href="#h_b1098f4b64" id="h_b1098f4b64"></a>

Calculation method is the aggregation function used to graph.

There are 3 options

* Average
* 85th Percentile
* Total

If the metric has only one time of calculation method supported, this field will show empty.

<figure><img src="https://downloads.intercomcdn.com/i/o/1018306703/d9cb85adbc04c1a201fb6ec6/Screen+Shot+2024-04-11+at+11_28_54+AM.png" alt=""><figcaption></figcaption></figure>

### Select group by <a href="#h_0361ee70c1" id="h_0361ee70c1"></a>

Group by allows you to see divide the calculation into multiple buckets.

Group by options changes depending on the [base metric entity type](#h_702f947474) being Sprint, Issue, Pull Request or Deployments.

<figure><img src="https://downloads.intercomcdn.com/i/o/1018308245/af18cc4bf6b34440f3ea4bf0/Screen+Shot+2024-04-11+at+11_30_42+AM.png" alt=""><figcaption></figcaption></figure>

### Select teams <a href="#h_3c2b9d10fa" id="h_3c2b9d10fa"></a>

Teams section does the same thing as [filters section](#h_f37da24533). It's a hyper specific filter that's put into front for easier usage.

Once you open the dropdown you will see 2 sections

* **My subscribed teams**: Any team you see in your left sidebar are your subscribed teams.
* **Other teams**: Any team that you have not subscribed.

<figure><img src="https://downloads.intercomcdn.com/i/o/1018310152/3f1ccbcfcd34098cd664fad1/Screen+Shot+2024-04-11+at+11_32_56+AM.png" alt=""><figcaption></figcaption></figure>

**Note:**

* Reports created in [Team metrics](https://delivery.usehaystack.io/team/metrics) does not support Teams filter. It automatically selects the selected team.

### Select filters <a href="#h_f37da24533" id="h_f37da24533"></a>

Allows you to filter the data.

Filter options changes depending on the [base metric entity type](#h_702f947474) being Sprint, Issue, Pull Request or Deployments.

<figure><img src="https://downloads.intercomcdn.com/i/o/1018314501/03483b03e6fd6d2ac8d52ea4/Screen+Shot+2024-04-11+at+11_38_12+AM.png" alt=""><figcaption></figcaption></figure>

Note:

* Filter only supports "filtering in".
* It does not support "filtering out".

### Select visualization (Graph type) <a href="#h_950548324d" id="h_950548324d"></a>

You can visualize your reports in different ways.

The following options are supported

* Line
* Area
* Bar
* Stacked bar
* Value

<figure><img src="https://downloads.intercomcdn.com/i/o/1018316801/1d94b100eea9b7920407fd16/Screen+Shot+2024-04-11+at+11_41_10+AM.png" alt=""><figcaption></figcaption></figure>

### Select timeframe <a href="#h_f9bf6e45a8" id="h_f9bf6e45a8"></a>

Time frame or date filter is a specialised [filter](#h_f37da24533) that filter-in only the entities that were in the given time frame.

It also changes the xAxis for Line & Area charts.

<figure><img src="https://downloads.intercomcdn.com/i/o/1018321062/5989be61ad524b8bbd9733f5/Screen+Shot+2024-04-11+at+11_46_22+AM.png" alt=""><figcaption></figcaption></figure>

### Select graph ticks <a href="#h_a0f4f00a8c" id="h_a0f4f00a8c"></a>

Supports 3 options

* By week
* By month
* By quarter

<figure><img src="https://downloads.intercomcdn.com/i/o/1018322211/ebd7d70c3bc21a31a7bc5b64/Screen+Shot+2024-04-11+at+11_47_45+AM.png" alt=""><figcaption></figcaption></figure>

This dropdown does 2 different work depending on the visualization type

* For Line and Area visualization types it changes the graph tick.
* For Bar, Stacked Bar and Value visualization types it runs the calculation method `per week/month/quarter` .

Example:

* [Issue completed per week - Line Chart](https://cdn.zappy.app/346ac4ad338d0f3af8b66d067a9c18b6.png)
  * Gives each week one by one
* [Issue completed per week - Value Chart](https://cdn.zappy.app/f812efa7811ea9838fd3d02fa8291f8b.png)
  * Gives the average across all weeks

### Trend Line (optional) <a href="#h_a5c3a291fe" id="h_a5c3a291fe"></a>

The trendline option is only available for Line chart visaulization.

You can enable or disable it.

Trendline uses [Linear Regression](https://en.wikipedia.org/wiki/Linear_regression).

<figure><img src="https://downloads.intercomcdn.com/i/o/1018327462/726b6f4dbd800768f6c75292/Screen+Shot+2024-04-11+at+11_53_49+AM.png" alt=""><figcaption></figcaption></figure>

## Note Widget <a href="#h_d51e7ec7ae" id="h_d51e7ec7ae"></a>

You can create a note widget which supports richtext formats.

<figure><img src="https://downloads.intercomcdn.com/i/o/1021925044/3b9a9d9eddf106c633c3619a/Screen+Shot+2024-04-15+at+4_16_47+PM.png" alt=""><figcaption></figcaption></figure>

***

## FAQ <a href="#h_3deaae43b1" id="h_3deaae43b1"></a>

### Is vertical stacked bar chart supported? <a href="#h_33a10b82b2" id="h_33a10b82b2"></a>

No.

Vertical stacked bar has xAxis is time, yAxis is metric.

The same visualization type can be achieved using Area Chart. To simplify the options, we do not support vertical stacked bar chart.

### How does the reports handle duplicate data? <a href="#h_cef412e323" id="h_cef412e323"></a>

Reports work in the following manner

1. Get raw data
2. Make raw data unique
3. Calculate metric

This process ensures no data is counted twice, regardless of what filter you select.

### Can I filter out data from the metrics? <a href="#h_408813604c" id="h_408813604c"></a>

No. Haystack only supports filter-in option.

### Do you track X metric? <a href="#h_c0d5879105" id="h_c0d5879105"></a>

See this page for a list of [all metrics](/features/list-of-all-metrics) and calculations.

### How is X metric calculated? <a href="#h_532b1dde91" id="h_532b1dde91"></a>

See this page for a list of [all metrics](/features/list-of-all-metrics) and calculations.

<br>


# Flexible Reports

Learn how to create a new Board

{% hint style="info" %}
Looking to report team specific metrics? Checkout [Team Reports](/features/team-metrics).
{% endhint %}

[Reports page](https://delivery.usehaystack.io/reports), gives a you ability to create custom boards for different use cases.

Below we'll learn how to use Reports page.

<figure><img src="https://downloads.intercomcdn.com/i/o/1018877601/68370fef70316ec62e939938/Screen+Shot+2024-04-11+at+8_04_01+PM.png" alt=""><figcaption></figcaption></figure>

{% hint style="info" %}
Check [all metrics Haystack supports](/features/list-of-all-metrics)
{% endhint %}

Boards are a layer on top of graphs allowing you to have multiple graphs in a single view.

<figure><img src="https://downloads.intercomcdn.com/i/o/1018879694/bd61b14e341160fe8649d7f2/Screen+Shot+2024-04-11+at+8_06_30+PM.png" alt=""><figcaption></figcaption></figure>

## Create Boards <a href="#h_d266befc2f" id="h_d266befc2f"></a>

You can create a new board using the "Add new board" buttons.

<figure><img src="https://downloads.intercomcdn.com/i/o/1018878407/73e0d75792d493e3ea403d59/Screen+Shot+2024-04-11+at+8_05_10+PM.png" alt=""><figcaption></figcaption></figure>

You will see 2 options

1. Blank report
2. [Templates](/features/flexible-reports)

<figure><img src="https://downloads.intercomcdn.com/i/o/1018881159/934ff5b92a4af96e7d4389ee/Screen+Shot+2024-04-11+at+8_07_52+PM.png" alt=""><figcaption></figcaption></figure>

Templates are a set of pre-defined reports combined into a single board.

\
The following templates are available

* **Operational Health Metrics**: Track metrics that every software team should have eyes on
* **Team Health**: Understand how your teams are working
* **Delivery Lifecycle**: Understand issue lifecycle and where to focus
* **Code Review Lifecycle**: Understand code review lifecycle and where to focus

Once you have selected your template you can click "Use template" to create the board.

<figure><img src="https://downloads.intercomcdn.com/i/o/1018884287/8cbc4c8322b26ab3a4fd614b/Screen+Shot+2024-04-11+at+8_10_41+PM.png" alt=""><figcaption></figcaption></figure>

**Note**:

* You can always delete any board. Feel free to test what you are looking for.

## Edit Board <a href="#h_af6a40274c" id="h_af6a40274c"></a>

### Add Widget <a href="#h_bbebbb3f0a" id="h_bbebbb3f0a"></a>

{% hint style="info" %}
Read more on [Customizable Widgets](/features/team-metrics)
{% endhint %}

You can add a new Widget in 2 ways

1. **Add Report Button**
2. **Add Content Button**

<figure><img src="https://downloads.intercomcdn.com/i/o/1018271794/d8e79d218e47d074bd7075d1/Screen+Shot+2024-04-11+at+10_50_07+AM.png" alt=""><figcaption></figcaption></figure>

Once you click on them, you'll see 2 options

1. **Report widget**: Adds flexible reports
2. **Note widget**: Notepad that supports richtext editor.

<figure><img src="https://downloads.intercomcdn.com/i/o/1018274713/559622694b1a1318538c70d3/Screen+Shot+2024-04-11+at+10_53_24+AM.png" alt=""><figcaption></figcaption></figure>

Below is an example how both are being used together.

<figure><img src="https://downloads.intercomcdn.com/i/o/1018274532/bab896fa13496e0e69e9759d/Screen+Shot+2024-04-11+at+10_53_07+AM.png" alt=""><figcaption></figcaption></figure>

### Update Report Order <a href="#h_264eb61f30" id="h_264eb61f30"></a>

If you hover over any content you'll see 3 lines logo. Holding this will allow you to rearrange the order of the graphs

<figure><img src="https://downloads.intercomcdn.com/i/o/1018280610/e712f36f64e91f42c0742d35/Screen+Shot+2024-04-11+at+11_00_17+AM.png" alt=""><figcaption></figcaption></figure>

### Update Filters <a href="#h_4713982011" id="h_4713982011"></a>

Filters allow you to quickly set common filter types across all graphs in that board with ease.

You need to press "Save" button for the filters to take action. Once saved, all the graphs respective filters will be updated individually.

### Update Date Filter <a href="#h_c3a43f7c6f" id="h_c3a43f7c6f"></a>

Easily filter all boards using your selected date range.

Alternatively, you can make the 'End Date' dynamic in your reports by setting a fixed 'Start Date' (e.g., January 1st). The 'End Date' will automatically adjust to always reflect today's date.

To Enable Dynamic Date Filtering:

1. &#x20;Locate the 'Since' slider button in date filter settings.
2. Toggle the slider to enable the feature.
3. Set your desired 'Start Date' as input.

<figure><img src="/files/lCPeUKzZgSGKWxh6CxqB" alt=""><figcaption></figcaption></figure>

**Note**:

* Default - the board will show each graphs original date filter supporting different time ranges being shown in a single board.
* You cannot filter earlier than 12 months. Contact us at <support@usehaystack.io> if you are looking to get more access.

### Update Team Filter <a href="#h_6bee25c9c2" id="h_6bee25c9c2"></a>

You can quickly filter all boards to teams you have selected.\
​

Once you open the dropdown you will see 2 sections

* My subscribed teams: Any team you see in your left sidebar are your subscribed teams.
* Other teams: Any team that you have not subscribed.

<figure><img src="https://downloads.intercomcdn.com/i/o/1018903587/bb57226d3f13339260589e90/Screen+Shot+2024-04-11+at+8_28_59+PM.png" alt=""><figcaption></figcaption></figure>

**Note**: Default - the board will show each graphs original team filter supporting supporting different teams being shown in a single board.

### Update board name <a href="#h_aaf39be08c" id="h_aaf39be08c"></a>

You can change a boards name & their description.

<figure><img src="https://downloads.intercomcdn.com/i/o/1018885522/af5989a8664e0e3267736a78/Screen+Shot+2024-04-11+at+8_12_12+PM.png" alt=""><figcaption></figcaption></figure>

### Update access permissions <a href="#h_0e423dca52" id="h_0e423dca52"></a>

You can change the access of each board to either

* **Public**: Everyone who has access to Haystack will be see the board in the "All boards" list
* **Private**: Only you can see private boards.

<figure><img src="https://haystack-cf20ab244ac6.intercom-attachments-1.com/i/o/1018908000/1efa20a53cacf398b7148e85/d029ba8d13c086ba6884fd980f2f82b4.png" alt=""><figcaption></figcaption></figure>

### Add to Favorites <a href="#h_e7e745bdc4" id="h_e7e745bdc4"></a>

You can set

* any public board
* your private boards

as your favorite board.

Once you have at least 1 favorite board, on the sidebar "Favorites" section will appear .

<figure><img src="https://downloads.intercomcdn.com/i/o/1018889511/9753fd833f23d38a523a4d0c/Screen+Shot+2024-04-11+at+8_16_02+PM.png" alt=""><figcaption></figcaption></figure>

You can also set favorite boards by hovering over All boards list.

<figure><img src="https://downloads.intercomcdn.com/i/o/1018890516/0bf5b67229cbe41bce9a9332/Screen+Shot+2024-04-11+at+8_16_36+PM.png" alt=""><figcaption></figcaption></figure>

## Duplicate Board <a href="#h_0f71700366" id="h_0f71700366"></a>

Duplicating a board will copy everything including all the boards underneath as a new board.

<figure><img src="https://downloads.intercomcdn.com/i/o/1018896374/5a84e2121c1b4385b2bf09ce/Screen+Shot+2024-04-11+at+8_21_53+PM.png" alt=""><figcaption></figcaption></figure>

## Delete Board <a href="#h_b348cf509c" id="h_b348cf509c"></a>

Deleting a board will delete everything related with that board. Anyone who has access to the board or has it as favorite will lose that access.

This action is not reversible.

<figure><img src="https://downloads.intercomcdn.com/i/o/1018897555/af026dd3f61828ba7a9d39ad/Screen+Shot+2024-04-11+at+8_22_55+PM.png" alt=""><figcaption></figcaption></figure>

## Share Board <a href="#h_990731919e" id="h_990731919e"></a>

You can share the whole board with a few clicks.

The following options are supported

* **Export as CSV**: Shares each boards data in CSV format.
* **Export as PNG**: Takes a screenshot of the board in png format.
* **Copy Link**: Shares the board link. You can also share the link from the browser.
  * *When sharing a board, make sure that the board* [*permission*](/features/flexible-reports) *is set as "public".*
  * *Only people who has access to Haystack can see the shared links*

<figure><img src="https://downloads.intercomcdn.com/i/o/1018898799/94bb4fcdddb5fd1618d57f81/Screen+Shot+2024-04-11+at+8_24_03+PM.png" alt=""><figcaption></figcaption></figure>

## Examples <a href="#h_ee665dbe64" id="h_ee665dbe64"></a>

### Operational Metrics Board <a href="#h_df4aba3534" id="h_df4aba3534"></a>

You can read more on [First Principles of Engineering Metrics](https://www.notion.so/usehaystack/First-Principles-of-Engineering-Metrics-1b4ae891164144fcb8c04a264849a3c3?pvs=4)

**Speed:**

* Issue Cycle Time
* Issue Completed

**Quality:**

* Issue Lead Time
  * filter by bugs
* Issue Completed
  * filter by bugs

**Predictability:**

* Sprint Predictability Rate
* Issue Completed
  * group by Investments

<figure><img src="https://cdn.zappy.app/5a2b89be32a8edf903e12abffac68b85.png" alt=""><figcaption></figcaption></figure>

### Quality Board <a href="#h_a39124871c" id="h_a39124871c"></a>

You can read more on [How to Improve Quality](https://www.notion.so/usehaystack/Quality-for-Product-Engineering-Teams-13a9f9ec734a4f179b786fcaf7310bc5?pvs=4).

**Main Metrics**

* Issue Lead Time
  * filter by bugs
* Issue Completed
  * filter by bugs

**Debugging Metrics**

* Issue Lead Time
  * group by teams
  * filter by bugs
* Issues Completed
  * group by teams
  * filter by bugs
* Issue Lead Time
  * group by priority
  * filter by bugs
* Issues Completed
  * group by priority
  * filter by bugs

<figure><img src="https://cdn.zappy.app/1b226595bef1ba5984ccd2824424045c.png" alt=""><figcaption></figcaption></figure>

### Estimation Accuracy <a href="#h_1bfff5943a" id="h_1bfff5943a"></a>

**Main Metrics**

* Sprint Predictability Rate

**Debugging Metrics**

* Issues Completed
  * Group by Investments
* Issue Cycle Time
  * Group by Story points
* Issues Injected
* PRs unlinked

<figure><img src="https://cdn.zappy.app/394daf39db3392760ca6e2cf2b98aa23.png" alt=""><figcaption></figcaption></figure>

## FAQ <a href="#h_da76500108" id="h_da76500108"></a>

<details>

<summary>What’s the difference between Team Metrics and Reports pages?</summary>

[Team metrics](https://delivery.usehaystack.io/team/metrics) is purposefully built for a single team. This gives teams a dedicated place to review metrics that are most relevant to that particular team.

[Reports](https://delivery.usehaystack.io/reports) provides flexible reporting across all teams.

</details>

<details>

<summary>Do you track X metric?</summary>

See this page for a list of [all metrics](/features/list-of-all-metrics) and calculations.

</details>

<details>

<summary>How is X metric calculated?</summary>

See this page for a list of [all metrics](/features/list-of-all-metrics) and calculations.

</details>

<details>

<summary>Can I see this per X?</summary>

Yes, most likely.

You can group by any field in Github or Jira. For Github Metrics (i.e. Review Time, PRs Merged, etc) you’ll be able to group by any field in Github. Similarly for Jira Metrics (i.e. Cycle Time, Sprint Completion, etc) you’ll be able to group by any field in Jira.

For more info check [Add Reports](/features/customizable-widgets)

</details>

<details>

<summary>Can I filter to only contain X?</summary>

Yes, most likely.

You can filter by any field in Github or Jira. For Github Metrics (i.e. Review Time, PRs Merged, etc) you’ll be able to filter by any field in Github. Similarly for Jira Metrics (i.e. Cycle Time, Sprint Completion, etc) you’ll be able to filter by any field in Jira.

For more info check [Add Reports](/features/customizable-widgets)

</details>

<details>

<summary>What reports should I track?</summary>

See this page for a list of all our favorite boards.

</details>

<details>

<summary>Can I duplicate an existing board?</summary>

You can duplicate an existing board only in [Reports](https://delivery.usehaystack.io/reports) page.

In [Team metrics](https://delivery.usehaystack.io/team/metrics) page, you cannot duplicate or copy a board from one team to another.

</details>

<details>

<summary>Can I update all reports on a board?</summary>

Yes, simply update the [filter](#h_4713982011) at the top of any board. This will filter all reports on that board. You can additionally save your filter if you’d like to change the board’s default filters.

</details>


# Team Metrics

Learn how to use the Team Metrics

{% hint style="info" %}
Looking to report across multiple teams? Checkout [Flexible Reports](/features/flexible-reports)
{% endhint %}

[Metrics page](https://delivery.usehaystack.io/team/metrics), gives each team a dedicated place to have their own metrics.

<figure><img src="https://downloads.intercomcdn.com/i/o/1018267297/074d878d64cdee16ae223eb1/Screen+Shot+2024-04-11+at+10_44_39+AM.png" alt=""><figcaption></figcaption></figure>

All graphs created inside Metrics page will automatically be filtered by that teams work allowing you to easily see what's important for you.

## Add Widget <a href="#h_62853cf5db" id="h_62853cf5db"></a>

{% hint style="info" %}
Read [How to create a Report](/features/customizable-widgets)
{% endhint %}

You can add a new Report in 2 ways

1. **Add Report Button**
2. **Add Content Button**

<figure><img src="https://downloads.intercomcdn.com/i/o/1018271794/d8e79d218e47d074bd7075d1/Screen+Shot+2024-04-11+at+10_50_07+AM.png" alt=""><figcaption></figcaption></figure>

Once you click on them, you'll see 2 options

1. **Add report**: Adds flexible reports (read more on [Reports](/features/team-metrics))
2. **Add note**: Notepad that supports richtext editor.

<figure><img src="https://downloads.intercomcdn.com/i/o/1018274713/559622694b1a1318538c70d3/Screen+Shot+2024-04-11+at+10_53_24+AM.png" alt=""><figcaption></figcaption></figure>

Below is an example how both are being used together.

<figure><img src="https://downloads.intercomcdn.com/i/o/1018274532/bab896fa13496e0e69e9759d/Screen+Shot+2024-04-11+at+10_53_07+AM.png" alt=""><figcaption></figcaption></figure>

## Update Widget Order <a href="#h_af2825f9a3" id="h_af2825f9a3"></a>

If you hoverover any content you'll see 3 lines logo. Holding this will allow you to rearrange the order of the graphs

<figure><img src="https://downloads.intercomcdn.com/i/o/1018280610/e712f36f64e91f42c0742d35/Screen+Shot+2024-04-11+at+11_00_17+AM.png" alt=""><figcaption></figcaption></figure>

## Update Filters <a href="#h_489bcbc2d3" id="h_489bcbc2d3"></a>

Easily filter all boards using your selected date range.

Alternatively, you can make the 'End Date' dynamic in your reports by setting a fixed 'Start Date' (e.g., January 1st). The 'End Date' will automatically adjust to always reflect today's date.

To Enable Dynamic Date Filtering:

1. &#x20;Locate the 'Since' slider button in date filter settings.
2. Toggle the slider to enable the feature.
3. Set your desired 'Start Date' as input.

<figure><img src="/files/lCPeUKzZgSGKWxh6CxqB" alt=""><figcaption></figcaption></figure>

**Notes**:

* You need to press "Save" button for the filters to take action.
* Once saved, all the graphs date filters will be updated individually.
* Default - the board will show each graphs original date filter supporting different time ranges being shown in a single board.

## Share Board <a href="#h_fe6f9219e8" id="h_fe6f9219e8"></a>

You can share the whole board with a few clicks.

The following options are supported

* **Export as CSV**: Shares each boards data in CSV format.
* **Export as PNG**: Takes a screenshot of the board in png format.
* **Copy Link**: Shares the board link. You can also share the link from the browser.
  * *Note: Only people who has access to Haystack can see the shared links*

<figure><img src="https://downloads.intercomcdn.com/i/o/1018285048/a778c602047868cf4b9db435/Screen+Shot+2024-04-11+at+11_05_20+AM.png" alt=""><figcaption></figcaption></figure>

## Examples <a href="#h_022f7409bc" id="h_022f7409bc"></a>

### Operational Metrics Board <a href="#h_df4aba3534" id="h_df4aba3534"></a>

You can read more on [First Principles of Engineering Metrics](https://www.notion.so/usehaystack/First-Principles-of-Engineering-Metrics-1b4ae891164144fcb8c04a264849a3c3?pvs=4)

**Speed:**

* Issue Cycle Time
* Issue Completed

**Quality:**

* Issue Lead Time
  * filter by bugs
* Issue Completed
  * filter by bugs

**Predictability:**

* Sprint Predictability Rate
* Issue Completed
  * group by Investments

<figure><img src="https://cdn.zappy.app/5a2b89be32a8edf903e12abffac68b85.png" alt=""><figcaption></figcaption></figure>

### Quality Board <a href="#h_a39124871c" id="h_a39124871c"></a>

You can read more on [How to Improve Quality](https://www.notion.so/usehaystack/Quality-for-Product-Engineering-Teams-13a9f9ec734a4f179b786fcaf7310bc5?pvs=4).

**Main Metrics**

* Issue Lead Time
  * filter by bugs
* Issue Completed
  * filter by bugs

**Debugging Metrics**

* Issue Lead Time
  * group by teams
  * filter by bugs
* Issues Completed
  * group by teams
  * filter by bugs
* Issue Lead Time
  * group by priority
  * filter by bugs
* Issues Completed
  * group by priority
  * filter by bugs

<figure><img src="https://cdn.zappy.app/1b226595bef1ba5984ccd2824424045c.png" alt=""><figcaption></figcaption></figure>

### Estimation Accuracy <a href="#h_1bfff5943a" id="h_1bfff5943a"></a>

**Main Metrics**

* Sprint Predictability Rate

**Debugging Metrics**

* Issues Completed
  * Group by Investments
* Issue Cycle Time
  * Group by Story points
* Issues Injected
* PRs unlinked

<figure><img src="https://cdn.zappy.app/394daf39db3392760ca6e2cf2b98aa23.png" alt=""><figcaption></figcaption></figure>

## FAQ <a href="#h_6d377d2a30" id="h_6d377d2a30"></a>

### What’s the difference between Team Metrics and Reports pages? <a href="#h_aab90991bc" id="h_aab90991bc"></a>

[Team metrics](https://delivery.usehaystack.io/team/metrics) is purposefully built for a single team. This gives teams a dedicated place to review metrics that are most relevant to that particular team.

[Reports](https://delivery.usehaystack.io/reports) provides flexible reporting across all teams.

### Do you track X metric? <a href="#h_96154d9481" id="h_96154d9481"></a>

See this page for a list of [all metrics](/features/list-of-all-metrics) and calculations.

### How is X metric calculated? <a href="#h_170013e1e5" id="h_170013e1e5"></a>

See this page for a list of [all metrics](/features/list-of-all-metrics) and calculations.

### Can I see this per X? <a href="#h_32ff2c4d72" id="h_32ff2c4d72"></a>

Yes, most likely.

You can group by any field in Github or Jira. For Github Metrics (i.e. Review Time, PRs Merged, etc) you’ll be able to group by any field in Github. Similarly for Jira Metrics (i.e. Cycle Time, Sprint Completion, etc) you’ll be able to group by any field in Jira.

For more info check [Add Reports](/features/customizable-widgets)

### Can I filter to only contain X? <a href="#h_0c9f71d91f" id="h_0c9f71d91f"></a>

Yes, most likely.

You can filter by any field in Github or Jira. For Github Metrics (i.e. Review Time, PRs Merged, etc) you’ll be able to filter by any field in Github. Similarly for Jira Metrics (i.e. Cycle Time, Sprint Completion, etc) you’ll be able to filter by any field in Jira.

For more info check [Add Reports](/features/customizable-widgets)

### What reports should I track? <a href="#h_78118c5a5b" id="h_78118c5a5b"></a>

See this page for a list of all our favorite boards.

### Can I duplicate an existing board? <a href="#h_741a79314a" id="h_741a79314a"></a>

You can duplicate an existing board only in [Reports](https://delivery.usehaystack.io/reports) page.

In [Team metrics](https://delivery.usehaystack.io/team/metrics) page, you cannot duplicate or copy a board from one team to another.

### Can I update all reports on a board? <a href="#h_130d73b151" id="h_130d73b151"></a>

Yes, simply update the filter at the top of any board. This will filter all reports on that board. You can additionally save your filter if you’d like to change the board’s default filters.

<br>


# List of All Metrics

Here are the available metrics within Haystack

<table><thead><tr><th width="139">Metric Type</th><th width="191">Metric</th><th>Definition</th></tr></thead><tbody><tr><td>Issue</td><td>Issue Cycle Time</td><td>Total time an issue spends in the "In-Progress" status category</td></tr><tr><td></td><td>Issue Lead Time</td><td>Time from issue creation to the issue being moved to the "Done" status category</td></tr><tr><td></td><td>Issue Time in Status</td><td>Time an issue spends in each status category, broken down by status</td></tr><tr><td></td><td>Issues Created</td><td>Number of issues created</td></tr><tr><td></td><td>Issues Completed</td><td>Number of issues moved to the "Done" status category</td></tr><tr><td></td><td>Points Completed</td><td>Number of story points associated with issues moved to the "Done" status category. Issues without story points are counted as 0.</td></tr><tr><td></td><td>Issues Injected</td><td>Number of issues added to the sprint after it started</td></tr><tr><td></td><td>Points Injected</td><td>Number of story points associated with issues injected into the sprint. Issues without story points are counted as 0.</td></tr><tr><td></td><td>Issues Completed Per Member</td><td>Number of issues moved to the "Done" status category per team member</td></tr><tr><td></td><td>Points Completed Per Member</td><td>Number of story points moved to the "Done" status category per team member. Issues without story points are counted as 0.</td></tr><tr><td></td><td>Issues Created Per Member</td><td>Number of issues created per team member</td></tr><tr><td>PR</td><td>PR Review Time</td><td>Time from pull request open to merging. Time in draft states are excluded from review time calculation.</td></tr><tr><td></td><td>PR Review Time Breakdown</td><td>Breakdown of review time includes three metrics: first response, rework, and idle completion time. Sum of these three equals the review time metric.</td></tr><tr><td></td><td>First Response Time</td><td>Time from pull request open to the first comment. If no comments exist, first response time is 0.</td></tr><tr><td></td><td>Rework Time</td><td>Time from first comment to last commit. If no comments exist, pull request open is considered the start time of rework time</td></tr><tr><td></td><td>Idle Completion Time</td><td>Time after rework is completed to merging a pull request</td></tr><tr><td></td><td>PRs Merged</td><td>Number of pull requests merged</td></tr><tr><td></td><td>PRs Unlinked</td><td>Number of pull requests unlinked to a Jira issue</td></tr><tr><td></td><td>PRs Merged Per Member</td><td>Number of pull requests merged per member</td></tr><tr><td>Sprint</td><td>Sprint Completion Rate (Issues)</td><td>Number of issues completed over total number of issues at the end of the sprint</td></tr><tr><td></td><td>Sprint Completion Rate (Points)</td><td>Number of points completed over total number of points at the end of the sprint</td></tr><tr><td></td><td>Commitment Reliability Rate (Issues)</td><td>% of issues completed out of the total sprint scope (excluding injected issues)</td></tr><tr><td></td><td>Commitment Reliability Rate (Points)</td><td>% of story points completed out of the total sprint scope (excluding injected issues)</td></tr><tr><td>Deployment</td><td>Deployments Count</td><td>Number of deployments made</td></tr></tbody></table>

## Customizations <a href="#h_695626fdd7" id="h_695626fdd7"></a>

You can group by or filter any metric based on their metric type.

<table><thead><tr><th width="174">Metric Type</th><th>Group by and Filter options</th></tr></thead><tbody><tr><td><strong>Issue or Sprint</strong></td><td>Assignee</td></tr><tr><td></td><td>Priority</td></tr><tr><td></td><td>Issue Type</td></tr><tr><td></td><td>Label</td></tr><tr><td></td><td>Project</td></tr><tr><td></td><td>SLA Status</td></tr><tr><td></td><td>Investment</td></tr><tr><td></td><td>Epic</td></tr><tr><td></td><td>Story Points</td></tr><tr><td></td><td>Custom JIRA Field</td></tr><tr><td></td><td>Team</td></tr><tr><td><strong>PR</strong></td><td>Author</td></tr><tr><td></td><td>Reviewer</td></tr><tr><td></td><td>Label</td></tr><tr><td></td><td>Repository</td></tr><tr><td></td><td>Team</td></tr><tr><td><strong>Deployment</strong></td><td>Service</td></tr><tr><td></td><td>Environment</td></tr><tr><td></td><td>Repository</td></tr><tr><td></td><td>Team</td></tr></tbody></table>

## FAQ <a href="#h_695626fdd7" id="h_695626fdd7"></a>

<details>

<summary>Can I track DORA metrics?</summary>

Haystack gives building blocks for each DORA metric. You'll need to create your own dashboard.&#x20;

* [Change Lead Time](#h_410aa1d99b) (Issue Cycle Time)
* [Deployment Frequency](#h_4f830cc15c) (Deployments Completed)
* [Mean Time to Recovery](/features/list-of-all-metrics#h_d824c0c5b3) (Issue Lead Time)
* [Change Failure Rate](#h_60ef6662ed)

If you are in the search of what metrics to track, we highly recommend checking the following posts.&#x20;

* [First Principles of Engineering Metrics](/guides/first-principles-of-engineering-metrics)
* [Engineering Metrics (Video Series)](/guides/engineering-metrics-video-series)

</details>

<details>

<summary>When to use average vs 85th percentile calculation method?</summary>

When deciding between using the average or the 85th percentile for calculations, consider these points:

* **Averages** are useful when your data is consistent and you don't expect outliers. However, they can be distorted by extreme values.
* **85th Percentile** is better for data with potential outliers. It gives a value below which 85% of the data falls, reducing the impact of extreme values.

For time-based metrics, which often have outliers, the 85th percentile is usually more appropriate. This method provides a clearer view of typical performance. Use the 85th percentile for metrics like:

* Issue Cycle Time
* Issue Lead Time
* PR Review Time
* Review Time Breakdown
* First Response Time
* Rework Time
* Idle Completion Time

## Why 85th percentile? <a href="#h_f3a0da9493" id="h_f3a0da9493"></a>

We'll be focusing on Issue Cycle Time metric and its distribution, but the base logic can be applied to all metrics mentioned above.

Issue Cycle Time is the total time spent in `in-progress` status category. Due to the nature of how developers work, we can see Issue Cycle Time being a long tail distribution:

![](/files/5RgkeRI5gzWDl7mJAke0)

If we use the average Issue Cycle Time, we will get **1.62 days**.

Average is a good indicator of understanding the total time spent and if the team is getting better using trends.

However, if we want to answer the question "How long would a new issue take?", it will fall short of answering this question. Average is skewed by lots of short few minutes or long issues.

If we look at median, we can say with 50% confidence that this issue will take **0.91 days**. Using the median is less practical since we will be ignoring all the bigger issues.

To answer the question, "how long would a new issue take to resolve?" we should use 85th percentile. Essentially this means that with 85% confidence, we can say that the given issue will be completed in 3.26 days.

Using 85th percentile gives us:

1. Practically point of view on how long it takes for the issue to be completed
2. The result doesn't get skewed by lots of shorter issues which most likely have lower business value.

## Conclusion <a href="#h_a9aed35f14" id="h_a9aed35f14"></a>

At Haystack, we want to give more actionable insights and decrease the amount of noise there is in the data. Looking at 85th percentile is an [industry-standard](https://www.scrum.org/resources/blog/getting-85-agile-metrics-actionableagile-part-1) among Product Managers.

We recommend using 85th percentile when calculating time metrics allowing you to understand and take action on your software delivery.<br>

</details>

<details>

<summary>Can I see Mean Time to Recovery (MTTR)?</summary>

Recommended Read: [How to Improve Quality](https://usehaystack.notion.site/Improving-Quality-bcc88c70311b4290b278d5227d92ecbd?pvs=4)

### Option 1: Track via Haystack <a href="#h_7b51c52d06" id="h_7b51c52d06"></a>

Haystack has a tight integration with Jira, but not with issue trackers. This means you'll need to utilize Jira to be able to track it inside Haystack.

This is also a best practice. All work that engineering team does should be tracked in their issue trackers.

**1. Create Jira Issues**

* Automatically create issues in Jira using [OpsGenie](https://support.atlassian.com/opsgenie/docs/view-team-alert-mttar-analytics/)
* Automatically create issues in Jira using [Pagerduty](https://support.pagerduty.com/docs/jira-cloud)

**2. Create Graph In Haystack**

Once you have created a consistent way to create tickets inside Jira whenever incident happens, next step is to track MTTR.

1. Go to [Reports](https://delivery.usehaystack.io/reports) page
2. Click [New Graph](https://cdn.zappy.app/e174e0699b568acb2ee26d75f3836b6f.png) icon
3. Select `Issue Lead Time` as the metric
4. Select the filters that represents an incidents
   1. Typically teams use
      1. `Issue Type: Bug` & `Priority: Highest`
      2. `Issue Type: Incident`
5. Select the visualization type
   1. Use `value` to see the raw number
   2. Use `line` to see it over time
6. Click Save

<img src="https://downloads.intercomcdn.com/i/o/1014748306/8c4cb9d093067ad6a02d50aa/Zappy+App+Screenshot+%283%29.png" alt="" data-size="original">

### Option 2: Track via Incident Management Systems <a href="#h_0c56373676" id="h_0c56373676"></a>

MTTR is a commodity metric meaning almost all Incident Management Systems support it built-in.

Below are the links for most common Incident Management Systems

* [Pagerduty](https://support.pagerduty.com/docs/insights)
* [OpsGenie](https://support.atlassian.com/opsgenie/docs/view-team-alert-mttar-analytics/)

</details>

<details>

<summary>Can I see Change Failure Rate (CFR)?</summary>

CFR is a metric that can be phrased as "Percentage of our deployments caused incidents".

As long as you have the definition of an incident, you will be able to track how CFR using either Issue completed or Deployments count filtered by an indicator that represents incidents.

Want more actionable metrics for quality? Checkout [How to Improve Quality?](/guides/how-to-improve-quality)

</details>

<details>

<summary>Can I see Development Time metric?</summary>

No.

As an alternative you can use **Issue time in status** metric which would give more reliable data.

Development time metric typically refers to time it takes to open a pull request. We have deprecated this metric as it was an unreliable metric. It's only available for older accounts.

There are 2 ways this metric can be calculated which both has reliability issues:

1. **JIRA**: Mixing timestamps of Version Control & Jira for the start and end of development time leads to large inconsistencies in the data; especially given unlinked pull requests, developers moving an issue to in-progress state chaoticly and other outliers that reduce data quality.
2. **Version Control**: Mixing timestamps of Version Control & Git for the start and end of development time leads to large inconsistencies in the data; especially given git squashing where it's easy to have 0 development time for some developers who uses this method.

</details>

<details>

<summary>How do I ensure if the metrics are correct?</summary>

You can always understand the raw data of any metric by clicking to the graph. A drill-in modal will appear with all the data points that was used to calculate that metric.

### How are my team metrics calculated? <a href="#h_f956d5820d" id="h_f956d5820d"></a>

The following settings effect how the teams metric is calculated

1. [Board Settings](https://cdn.zappy.app/3dac4e5ee40fb83f8f7f2e21798e14ed.png)
   1. **If Kanban**: Shows all issues in your board based on your settings
   2. **If Sprint**: Shows all issues in your sprint based on your settings.
      1. *Note: If an issue is in-progress but not in your sprint, Haystack will not show that issue.*
2. [Sprint Filter](https://cdn.zappy.app/93b090fc40d18bce29b06dc710806d05.png) (only for sprint based boards)
3. [Member Settings](https://cdn.zappy.app/f6a3b7c457c1eea86d54e64e0f303d77.png)
4. [Advanced Board Settings](https://cdn.zappy.app/9db1697d88b8fdd0edb7b034e151f76e.png)

You can always understand the raw data of any metric by clicking to the graph. A drill-in modal will appear with all the data points that was used to calculate that metric.

</details>

<details>

<summary>Do PR metrics count unlinked PRs?</summary>

Yes. All Pull Requests merged by team members will be included in calculations.&#x20;

If you want to check specifically unlinked PRs, check `PRs unlinked` metric.

</details>

<details>

<summary>Are Tasks/Stories/Epics/Subtasks calculated in Issue based metrics?</summary>

Haystack does an implicit filter on metrics to ensure the data looks correct with an initial glance.

`Subtask` and `Epic` issue types are not calculated part of any metric. All other issue types would be included in the metrics.

\
You can validate this by using "[Issue Type](/features/list-of-all-metrics)" filter.

</details>

<details>

<summary>Does Haystack exclude weekends and holidays?</summary>

Haystack does not exclude any particular date ranges like holidays, PTO, weekends, etc.

While initially this may feel like your metrics are artificially increased, we think about metrics from the perspective of the customer. In this case, the customer is still waiting during the weekends and the increased metrics continues to be a great signal on where bottlenecks might lie.

</details>


# API

{% hint style="info" %}
To access this feature, send a request to [support@usehaystack.io ](mailto:support@usehaystack.io)
{% endhint %}

## API Access

Haystack provides API access for metrics. Below you can find the API endpoints and process of how to use them.

The API has two different endpoints for metrics. The first one is `/metrics` endpoint that supports global metrics. The second one is `/teams/[teamId]/metrics` and it’s for specific teams.

Haystack supports a number of different filters and metric types. Thus, to make things easier, we added support for copying any metric as a cURL request. Then, one can transform that into any language/environment.

### Copy API Request Feature

In each metric in Haystack, you can find an option called `Copy API Request` . This function will give you the API cURL command to replicate the same behavior with the metric. We advise to use this feature, and then edit fields for your use case.

<figure><img src="/files/DBDX0dL6vrXFRO7vQCIZ" alt=""><figcaption></figcaption></figure>

<figure><img src="/files/17tPYRJA0aa5oDnxNsxF" alt=""><figcaption></figcaption></figure>

### Authentication

Authentication done via `Bearer` tokens. To create a token, please go <https://delivery.usehaystack.io/api-tokens> page and create a token. Keep in mind that the tokens will only be available to copy after the token is created.

<figure><img src="/files/IFMcntm9UCG0hTdk6Sop" alt=""><figcaption></figcaption></figure>

The token should be added as a header field. Example:

```jsx
Authorization: Bearer YOUR_API_TOKEN
```

### Requests

* **Endpoint Host**:
  * `https://api.usehaystack.io`
* **Endpoint URL**:
  1. `POST /public/api/team/:teamId/metrics` or `POST /public/api/metrics`
* **Request Params**
  * `teamId`: (Number) The ID of the team for which metrics are being requested. (Only exists if the endpoint is team endpoint)
* **Request Body**
  * `startDate`: (String) The start date of the metrics data range (format: YYYY-MM-DD).
  * `endDate`: (String) The end date of the metrics data range (format: YYYY-MM-DD).
  * `granularity`: (String) The granularity of the metrics data (week/month/cycle).
  * `type`: (String) The type of metrics data (issue/pull\_request/cycle/deployment).
  * `groupBy`: (String) The parameter to group the metrics data by (team/author/assignee/epic, and more).
  * `filters?` : the filter array, we advise you to use the filter array given by our `Copy API Request` feature

### Regular Responses

This responses are responses without `groupBy` and granularity selected as `week` or `month`. The responses include two different fields, `data` and `averages.`

* `data` : (Array) The metrics objects. Each object contains the following fields
  * `title` : (String) The title of the metric
  * `measure` : (String) Unique key of the metric
  * `series` : (Array) The values of the chart
    * `x` : (String) The x axis of the chart
    * `value` : (Number) The value
* `averages` : (Object) The averages of the results. This is used for `Value` chart types.
  * The averages object includes one or more then one fields. The name of the field depends on the request type.
  * The fields can be extracted from the `measure` field from the `data` . For instance if the measure is `jiraIssue.count`, then you should check for `averages>jiraIssue>count` for average of that metric.

#### Group By Responses

The structure of the group by responses are very similar to regular responses.

* `data` : (Array) The metrics objects. Each object contains the following fields
  * `key` (String) The unique key of the current groupby.
  * `values` (Array) The values for the metrics
    * `title` : (String) The title of the metric
    * `measure` : (String) Unique key of the metric
    * `series` : (Array) The values of the chart
      * `x` : (String) The x axis of the chart
      * `value` : (Number) The value
* `averages` : (Array) The averages of the results. This is used for `Value` chart types. Each item in the array exist for group by.
  * `key` (String) The unique key of the current groupby.
  * `values` (Array) The values for the metrics
    * The averages object includes one or more then one fields. The name of the field depends on the request type.
    * The fields can be extracted from the `measure` field from the `data` . For instance if the measure is `jiraIssue.count`, then you should check for `averages>[number]>value>jiraIssue>count` for average of that metric.

The rest of the fields in the response are for future use. You can ignore them for now.

### Granularity Cycle Responses

When granularity selected as `cycle`, the response returns the cycles with analytics. Here is an example response:

```
{
    "data": [
        {
            "name": "Sprint 25",
            "state": "closed",
            "analytics": {
                "completionRate": "0.72727272727272727273",
                "storyPointCompletionRate": 0.6166666666666667,
                "issueCount": "22",
                "totalStoryPoints": 60,
                "injectedIssueCount": "9",
                "injectedStoryPoints": 16,
                "completedIssueCount": "16",
                "completedStoryPoints": 37,
                "committedIssueCount": "13",
                "committedStoryPoints": 44,
                "excludedIssueCount": "3",
                "excludedStoryPoints": 0,
                "removedIssueCount": "0",
                "removedStoryPoints": null
            }
        }
    ],
    "averages": {
        "cycle": {
            "completionRate": 0.803030303030303,
            "storyPointCompletionRate": 0.7670110192837466,
            "issueCount": 27.5,
            "totalStoryPoints": 60.25,
            "injectedIssueCount": 14,
            "injectedStoryPoints": 20.5,
            "completedIssueCount": 22.5,
            "completedStoryPoints": 46.25,
            "committedIssueCount": 13.5,
            "committedStoryPoints": 39.75,
            "excludedIssueCount": 1.5,
            "excludedStoryPoints": 0,
            "removedIssueCount": 0,
            "removedStoryPoints": 0
        }
    }
}
```

### Rate Limits

20 requests per minute is allowed. After that, the system will give `429` as status code.

To increase this limit please contact <support@usehaystack.io>.

### Example

```jsx
POST <https://api.usehaystack.io/public/api/metrics>
Authorization: Bearer YOUR_TOKEN
Content-Type: application/json

{
    "startDate": "2023-01-01",
    "endDate": "2023-01-31",
    "granularity": "month",
    "type": "issue",
    "groupBy": "author"
}
```

<br>


# Embedded reports

Easily embed Haystack reports into platforms like Notion, Google Sheets, and custom dashboards

<figure><img src="/files/18HkMRq8SNsoTSaB9jZY" alt=""><figcaption><p>Example of embedded Haystack reports in Notion</p></figcaption></figure>

## Configure

1. Go to **Team metrics** or [Reports](https://delivery.usehaystack.io/reports) **-> Board.**
2. Choose report you want to embed.&#x20;
3. Go to **Menu -> Share -> Copy Embed**

   <figure><img src="/files/ys9WN0IZKw0WJNWTLQpd" alt=""><figcaption></figcaption></figure>
4. Paste it as embed into your desired platform.

## FAQ

<details>

<summary>I updated the original metric, but the embedded version hasn't changed. Why?</summary>

Embeddable metrics reflect the configuration as it was when you clicked the Copy Embed button. While the data updates dynamically, the chart’s configuration is a fixed snapshot at the time of embedding.

</details>


# Security & Privacy

Learn how we keep your data safe and meet compliance standards

We prioritize security and perform thorough audits of our applications, systems, and networks to safeguard your data. [Learn more](https://www.usehaystack.io/security)

## JIRA <a href="#h_10a7a31dfc" id="h_10a7a31dfc"></a>

List of data that is stored at Haystack:

<table><thead><tr><th width="206">Category</th><th>Data stored</th></tr></thead><tbody><tr><td>System  </td><td>Issue statuses, priority types, column types, etc.</td></tr><tr><td>Issues</td><td>Title, content, create/update date, assignee, creator, reporter, custom fields (e.g., story points, sprints), etc. </td></tr><tr><td>Issue history </td><td>Title changes, assignee changes, etc.</td></tr><tr><td>Issue comments </td><td>Content, author info, etc. </td></tr><tr><td>Projects  </td><td>Project name, type, key, issue types, etc.</td></tr><tr><td>Sprints</td><td>Start/end dates, title, state, etc. </td></tr><tr><td>Boards</td><td>Board JQL, title, column metadata, etc. </td></tr><tr><td>Members</td><td>Name, account ID, email, etc.</td></tr></tbody></table>

## Version Control (GitHub, GitLab, Bitbucket) <a href="#h_2322e933ed" id="h_2322e933ed"></a>

### Permissions needed

For Haystack to provide meaningful insights, it needs read-access to the git repositories you would like to include.

### Data usage

Haystack only uses metadata (messages, timestamps, status, tags) on pull requests, commits & comments.

{% hint style="success" %}
Haystack does **not** read, store, or persist source code.
{% endhint %}

## FAQ <a href="#h_ff99129c58" id="h_ff99129c58"></a>

<details>

<summary>Where can I see your security and privacy policies?</summary>

Here are the links to our [security](https://www.usehaystack.io/security) and [privacy](https://www.usehaystack.io/privacy) policies.

</details>

<details>

<summary>Do you store or read source code?</summary>

Haystack does **not** read, store, or persist source code.

</details>


# Data Sync

Data refresh times between Haystack and other integrations

## JIRA <a href="#h_eb0d33f627" id="h_eb0d33f627"></a>

### Refresh Rate <a href="#h_40c4a63fd0" id="h_40c4a63fd0"></a>

|                                                                                   | JIRA (with webhooks) | JIRA (without webhooks) |
| --------------------------------------------------------------------------------- | -------------------- | ----------------------- |
| Add entities                                                                      | 10 seconds           | 30 minutes              |
| Update entities                                                                   | 10 seconds           | 30 minutes              |
| Delete entities                                                                   | 10 seconds           | 24 hours                |
| System issue settings *(ex: board config changes like add/delete/update columns)* | Every weekend        | Every weekend           |

{% hint style="info" %}
Learn how to enable [webhooks (faster data sync)](/admin/data-sync/how-to-setup-faster-data-sync-for-jira) for JIRA.
{% endhint %}

### Edge cases <a href="#h_4ec9881566" id="h_4ec9881566"></a>

* Only first 250 comments on an issue is sync'd.
* Bug SLAs take 30 minutes to calculate after an issue has been sync'd.
* When a new Jira member is created, it takes 15 minutes for it to sync with a Git user. Read more on [mapping members](/setup/teams/map-members).

## Version Control <a href="#h_744c0cc01c" id="h_744c0cc01c"></a>

### Refresh Rate <a href="#h_f66c62ddcf" id="h_f66c62ddcf"></a>

|               | Github     | Bitbucket  | Gitlab     |
| ------------- | ---------- | ---------- | ---------- |
| Pull Requests | 30 seconds | 30 minutes | 30 minutes |
| Repositories  | 30 seconds | 24 hours   | 24 hours   |
| Deployments   | 30 minutes | 24 hours   | 24 hours   |

### Edge cases <a href="#h_5801436a45" id="h_5801436a45"></a>

* [Git rebase](https://git-scm.com/docs/git-rebase) changes history by deleting the commits.
  * **Github**: rebase commits are deleted in 24 hours
  * **Bitbucket**: rebase commits are not deleted
  * **Gitlab**: rebase commits are not deleted
* Only first 300 reviews on an pull request are sync'd

## FAQ <a href="#h_1fd5b3f9c7" id="h_1fd5b3f9c7"></a>

### Can I manually trigger data refresh? <a href="#h_1480c14404" id="h_1480c14404"></a>

No.

You can contact <support@usehaystack.io> to request for manual data refresh trigger.


# How to setup faster data sync for JIRA?

Get real time data sync for JIRA

Realtime data sync for JIRA allows Haystack to sync data with your JIRA boards almost instantly rather than having to wait 30 minutes for JIRA data to be reflected on Haystack!

|                             | With Real Time | Without Real time |
| --------------------------- | -------------- | ----------------- |
| Time to sync data with JIRA | 10 seconds     | 30 minutes        |

## There are two ways to do this <a href="#h_c254d57492" id="h_c254d57492"></a>

* [**Integrate JIRA with admin token**](#h_3f05a0e88a)
* [**Integrate JIRA without admin token**](#h_9e7f3961f4)

💡 We recommend you to share this article with your JIRA admin

### First Method: Integrate JIRA with admin token <a href="#h_3f05a0e88a" id="h_3f05a0e88a"></a>

To achieve real time sync, Haystack requires webhooks. In this method, you'll be giving admin token & our application will automatically create the webhooks for you.

All you need to do is swap the JIRA token you have provided with a JIRA admin's token.

You can follow the [steps here](/setup/integrations/jira).

### Second Method: Integrate JIRA without admin token <a href="#h_9e7f3961f4" id="h_9e7f3961f4"></a>

Alternatively, to achieve real time sync, you can create webhooks manually after integrating JIRA without an admin token!

#### **1. Get the webhook URL**

* If you have a the URL already you can skip this step. URL should look something like this

```
https://webhooks.usehaystack.io/xxxx-xxxx
```

* If not please contact our team at <support@usehaystack.io> to get your URL

#### **2. Head to your your JIRA dashboard. Click the settings icon on the top-right corner.**

<figure><img src="https://haystack-cf20ab244ac6.intercom-attachments-7.com/i/o/935580206/4b4ced0bfeac552f26b65c7e/68747470733a2f2f63646e2e7a617070792e6170702f66396134303866306463393963373262363265616531326665363263613539312e706e67" alt=""><figcaption></figcaption></figure>

#### **3. Click System Settings**

<figure><img src="https://haystack-cf20ab244ac6.intercom-attachments-7.com/i/o/935580211/f89d388de26f20b8c57da398/68747470733a2f2f63646e2e7a617070792e6170702f32373933633662663937356138623332363966346537636232616632303063332e706e67" alt=""><figcaption></figcaption></figure>

#### **4. Scroll down on the left menu, find** `Webhooks`**.**

<figure><img src="https://haystack-cf20ab244ac6.intercom-attachments-7.com/i/o/935580221/3279f4ea60bbd21fdf0d47da/68747470733a2f2f63646e2e7a617070792e6170702f33613262646364613263623136346363383364666164376339373632303037642e706e67" alt="" width="375"><figcaption></figcaption></figure>

#### **5. Click create new webhook on the top right corner.**

<figure><img src="https://haystack-cf20ab244ac6.intercom-attachments-7.com/i/o/935580224/d83d58b235650485b178bfce/68747470733a2f2f63646e2e7a617070792e6170702f30643135663963386636613838633666636263626266356664666135626561382e706e67" alt=""><figcaption></figcaption></figure>

#### **6. Provide webhook name & webhook URL you got from step (1)**

<figure><img src="https://haystack-cf20ab244ac6.intercom-attachments-7.com/i/o/935580230/3feb0483db9e0e6c0461f192/68747470733a2f2f63646e2e7a617070792e6170702f39383532313939613338366633613239613862373466646566666230653636372e706e67" alt=""><figcaption></figcaption></figure>

#### **7. Select all events under "Issue Related Events" & "User Related Events"**

<figure><img src="https://haystack-cf20ab244ac6.intercom-attachments-7.com/i/o/935580241/242e378f7a672f45a2779916/68747470733a2f2f63646e2e7a617070792e6170702f38363261643030383065656136636235643566343432386266396164346536342e706e67" alt=""><figcaption></figcaption></figure>

#### **8. Select all events under "JIRA configuration related events" & "Project related events"**

<figure><img src="https://haystack-cf20ab244ac6.intercom-attachments-7.com/i/o/935580245/7c81cbd5fbb1a0062610f0e0/68747470733a2f2f63646e2e7a617070792e6170702f32316261666134663461353335643335323730336566633038323539353766372e706e67" alt=""><figcaption></figcaption></figure>

#### **9. Select all events under "JIRA software related events"**

<figure><img src="https://haystack-cf20ab244ac6.intercom-attachments-7.com/i/o/935580250/e403e0edf44ab8d056f35e58/68747470733a2f2f63646e2e7a617070792e6170702f61313939616163656364633561656238383362616638353266373762373734382e706e67" alt=""><figcaption></figcaption></figure>

#### **10. Make sure "Exclude body" is unchecked**

<figure><img src="https://downloads.intercomcdn.com/i/o/937033472/2392b906c91b1e07e50abd37/Screenshot+2024-01-18+at+7.05.55%E2%80%AFPM.png" alt=""><figcaption></figcaption></figure>

#### **11. Click Create**

You should now be done! Haystack should start receiving the webhooks automatically.


# Account & Billing


# Managing Your Subscription: Billing, Plans & Cancellation

Everything you need to know about Haystack Delivery's pricing, billing management, paid add-ons, and cancellation.

### Free Trial

Haystack offers a **14-day free trial** — no credit card required. Get started in minutes at <https://auth.usehaystack.io/sign-up>.

***

### Subscription Plans

#### Growth Plan — $20/member per month (annual commitment)

Best for teams under 100 engineers.

* Unlimited alerts and notifications
* 12 months of historical data
* Email & Slack support
* Dedicated Account Specialist

#### Enterprise Plan

For organizations with 100+ engineers.

Everything in Growth, plus: - On-premise and custom integrations - Dedicated Performance Specialist - Quarterly performance reports - Team training and onboarding sessions - Custom pricing

***

### Paid Add-Ons

#### Surveys

Recurring pulse surveys to measure team sentiment across topics like collaboration, tooling, and workload. Contact your Account Specialist to enable.

#### API Access

Public API endpoints for extracting metrics programmatically. Contact <support@usehaystack.io> to enable.

***

### How Billing Works

#### What you're billed for

Haystack bills based on the number of **team members** added across your Haystack teams. This is the count of unique members assigned to at least one team in your workspace.

**Key clarification:** Billing counts every member added to any team — not just "active" users who logged into the dashboard. If an engineer is on a Haystack team but never opens the app, they still count toward your seat total.

#### How to check your current seat count

Go to **Members** from the top-left menu to see all members and their team assignments. A member on multiple teams counts as one seat (deduplicated).

***

### Updating Your Billing Information

**Who can do this:** Admins only.

1. Navigate to **Settings > Billing > Manage Payment**
2. A Stripe billing portal will open (make sure pop-ups are enabled in your browser)
3. You can update: billing email, billing address, phone number, Tax ID
4. Save your changes in the Stripe portal

**Note:** The default billing contact is whoever originally signed up for Haystack, or the billing address provided if your company signed up through Sales.

***

### Understanding Your Invoice

Your invoice reflects:

* **Number of team members** across all Haystack teams during the billing period
* **Plan tier** (Growth or Enterprise)
* **Add-ons** (Surveys, API access) if applicable

For Enterprise contract details, contact your Haystack account specialist. For specific line item questions, reach out via the in-app chat, Slack Connect channels or email <support@usehaystack.io>.

***

### Changing Your Plan

#### Upgrading to Enterprise

Contact your Account Specialist or email <sales@usehaystack.io>.

#### Downgrading from Enterprise to Growth

Contact your Account Specialist. Downgrades take effect at the end of your current billing period. Enterprise-only features (SSO, custom integrations, on-premise) will be removed.

#### Reducing your seat count

1. Go to **Team Settings > Members** for each team and remove departed engineers
2. Remove bot accounts that should not be tracked
3. Verify removed members no longer appear as active on the **Members** page

Seat count changes are reflected in your next billing cycle.

***

### Cancelling Your Subscription

To cancel your Haystack Delivery subscription:

**Email <support@usehaystack.io>** with:

1. Your company name
2. The admin email on your account
3. Your requested cancellation date (end of billing period, or immediate)
4. Our team will confirm cancellation and provide:
   1. Your final invoice date
   2. Data export options
   3. Confirmation once processed

**What happens after cancellation:**&#x20;

1. Your team retains access until the end of the current billing period&#x20;
2. Integrations (Jira, GitHub, Slack, etc.) are disconnected automatically
3. Surveys (if enabled) are deactivated immediately — active surveys will close&#x20;
4. If you need a full data export before cancellation, let us know and we'll arrange it

**Want to pause instead?** Talk to us about reducing seats or pausing. Contact <support@usehaystack.io>.

***

### Exporting Your Data

* Use **Flexible Reports** to export dashboards and reports as CSV or PNG
* Use the **Retrospective** page to export sprint data as CSV or PNG
* If API access is enabled, use the API for bulk data extraction
* For a full data export, contact <support@usehaystack.io>

***

### Data Deletion Requests

For GDPR or compliance-driven full data deletion:

1. Email **<support@usehaystack.io>** with subject: "Data Deletion Request — \[Company Name]"
2. Include: company name, admin email, whether you need a deletion confirmation certificate
3. We will remove all data, disconnect integrations, and confirm within 5 business days

**Note:** Data deletion is irreversible. Export any data you need first.

***

### FAQ

<details>

<summary>Why does my invoice amount change month to month?</summary>

Seat count fluctuates as you add/remove team members. Each billing cycle reflects the current count.

</details>

<details>

<summary>I'm an admin — why can't I see the billing page?</summary>

Make sure pop-ups are enabled. The billing portal opens via Stripe in a new window.

</details>

<details>

<summary>How do I transfer admin ownership?</summary>

Contact <support@usehaystack.io> with the current and new admin emails.

</details>

<details>

<summary>Does Haystack offer annual billing?</summary>

Enterprise plans include annual billing. Contact <sales@usehaystack.io>.

</details>

<details>

<summary>I have both DORA and Delivery — do I get billed twice?</summary>

Contact your Account Specialist to understand your combined billing arrangement. Seat counts may be shared or separate depending on your contract.

</details>


# Can I track Dora metrics?


# What is Status Category?

Difference between JIRA's Status Category, Status and Resolution

Jira has 4 fields that are often confused

1. **Status Category**: Groups various statuses into broader categories to provide a quick overview of a task's state. Has `To Do`, `In Progress`, and `Done`. These are used to uniformly understand the phase of a task across different projects.
2. **Status**: Describes the specific stage a task is in within its lifecycle. Examples include `In Progress`, `In Review`, `QA`, `Closed`. Each status belongs to one of the status categories, helping to map more detailed stages to simpler groupings.
3. **Resolution**: Indicates the final outcome of a task once it is closed. It explains why a task was closed, with options like `Done`, `Won't Do`, `Duplicate`. This field is typically empty while a task is still open or in progress.
4. **Column**: Represents a visual component on a board (like in Kanban or Scrum boards) that correlates to task status. Columns organize tasks visually by status, facilitating a clearer view of workflow and progress through statuses like `To Do`, `Doing`, `Done`.

Below is an example board reflecting different Status Categories, Statuses and Columns.

**Status Categories:**

* To Do (gray)
* In Progress (blue)
* Done (green)

**Columns:**

* TO DO
* IN PROGRESS
* IN REVIEW
* MERGED
* DONE

**Statuses:**

* TODO
* IN PROGRESS
* IN REVIEW
* MERGED
* DONE
* WON'T DO

You can access the following page from your [Board configurations](https://confluence.atlassian.com/jirasoftwareserver/configuring-a-board-938845252.html).

<figure><img src="https://downloads.intercomcdn.com/i/o/1016364103/3034f02c06b41af6a7278623/Screen+Shot+2024-04-09+at+5_00_35+PM.png?expires=1712676874&#x26;signature=3a68101da88ec41958ffcd3201de6088a8d29f30ed81ffedb3a0b0d370e099eb" alt=""><figcaption></figcaption></figure>


# First Principles of Engineering Metrics

All departments from Sales, Marketing to Product reports metrics to the CEO, except for Engineering Department!

I have worked with +1000 engineering teams helping them create a mature software engineering department.

In this blog, I’ll go over the first principle of metrics and which metrics you should be using.

## How other departments select their metrics?

The answer is very simple.

> What is the purpose of this department existing?

the answer to this question becomes clear by inverting the problem.

> What work does a department needs to stop doing for them to get fired?

Let’s answer this for other departments

### Sales Department

> What work does sales department needs to stop doing for them to get fired?

**Answer:** If a sales team stops selling, they’ll get fired

There is absolutely no sales team that will not get fired if they stop selling. We got our answer.

Now we need to invert it back to get the metric we should be tracking.

> What should I track for a sales team?

Answer: Amount they sold (Revenue)

So far so good. Let’s do another example with Marketing department

### Marketing Department

> What work does marketing department needs to stop doing for them to get fired?

**Answer:** Stop bring leads

This is a correct answer, but it’s missing. What if marketing department is bringing very bad leads? They’ll still get fired. So we need to add one more layer. They need to bring leads, but also ensure these leads can be turned into customers. If we add this to our answer we get

**Improved Answer:** Stop bringing **qualified** leads

Now let’s invert it again

> What should I track for a marketing team?

Answer: Marketing qualified leads (MQL)

{% hint style="info" %}
Each department track dozens of metrics from Win Rate to Response Time. These metrics are called *Leading Metrics*

* Leading metrics tell a small part of the whole story.
* Leading metrics are helpful to understand how we can optimize our operations further
* Every department should track leading metrics, with the purpose of improving the main metrics.
  {% endhint %}

## What should engineering departments track?

Let’s ask the same questions in order.

> What work does engineering department needs to stop doing for them to get fired?

Answer 1: Stop delivering code

Answer 2: Deliver code that doesn’t work

Answer 3: (optional) Deliver code too late

So if we reverse these we’ll answer the purpose of the engineering department.

> Deliver working code on-time

Breaking this down further

**Speed:** Deliver

**Quality:** working code

**Predictability:** on-time

Engineering team have 3 responsibilities. If any of them are lacking, that team is not doing their job.

If an engineering team is doing all 3 of these responsibilities at a level the organizations expects from them - they are doing their job.

{% hint style="info" %}
An engineering team succeeds if they **deliver working code on time**.
{% endhint %}

Now we know what an engineering team should track

* Speed
* Quality
* Predictability

To learn tactical advices on which metrics should an engineering department track message me at <kan@usehaystack.io>

***

**Notes:**

* Some engineering teams do not have a requirement for `on-time`.
* Tracking predictability is more useful for organizations with deadlines. (ex: sales led organizations where not delivering equates to lost deals)
* For all other types of organizations, predictability is a leading metric rather than the main metric.


# Engineering Metrics (Video Series)

## Introduction to the Series

{% embed url="<https://www.loom.com/share/0353433241e54d85bd9df16dc2f85691?sid=284ebc94-c1b4-41a0-9fea-207058aed91e>" %}

## Topic #1: When do you need engineering metrics?

{% embed url="<https://www.loom.com/share/f05058df35b04981a58539335aeea6a4>" %}

## Topic #2: How to Choose Engineering Metrics

{% embed url="<https://www.loom.com/share/c5dbd1307b364b0f91dc917790496f7d?sid=3cc85a92-93c7-4c49-b20b-70f8b6ae9aee>" %}

## Topic #3: Software Delivery Metrics

{% embed url="<https://www.loom.com/share/19e806066cb34322ac30e388dda83b41?sid=eb68b07e-2e1f-4ae7-9746-34a2d9278141>" %}


# How to Improve Quality?

## What to focus on?

Product engineers main purpose is to deliver value to customers in the form of features (code). The quality metrics should reflect this purpose.

There are 3 types of quality issues

1. **Incidents:** When a user cannot use the system.
2. **Production Bugs:** When a user fails to use a feature.
3. **Staging & Development Bugs:** Errors or issues identified pre-production. Doesn’t have impact on the user.

<figure><img src="/files/nuBfFZ97vN0WT47Uol8p" alt=""><figcaption></figcaption></figure>

There is major distinction between top 2 parts of the pyramid and the bottom layer.

The top 2 parts reflect “user pain”. Bottom part reflects “development pain”. As a business we should mainly care about users and engineering teams should align with business goals.

{% hint style="info" %}
Product Engineering teams should track customer facing bugs AKA

* Incidents
* Production Bugs
  {% endhint %}

**Incidents & Production Bugs**

* reflects user pain
* looked periodically (weekly/monthly)
* reported regularly (see [First Principles of Engineering Metrics](/guides/first-principles-of-engineering-metrics) )

**Staging & Development Bugs**

* reflects “development pain”
* used for optimization efforts (like implementing CI/CD, TDD, PR Review processes etc.)
* should NOT be reported

<details>

<summary>How to use metrics for non-customer facing bugs</summary>

There are a lot of bugs created from

* Logs (Sentry etc.)
* Staging testing
* Code Review
* Unit/integration/E2E tests
* QA
* …

The bugs generated from these channels might be as important as customer facing ones. The goal however is to ensure that customers face less bugs. To accomplish this goal, we should ensure bugs from staging & development does not release in front of customers.

Just like product team tracks main product metric like DAU, but also track every single button click, product engineering teams should track customer facing bugs as main metric & track non-customer facing bugs like button click.

A product manager doesn’t look at a button click analytic regularly. Same should apply for non-customer facing bugs. We should only look at them when we think our processes are broken and we need to improve our internal processes

</details>

## What metrics to track?

When using metrics, we should look into dual metric balancing between efficiency and effectiveness.

{% hint style="info" %}
**Bug Resolution Time**: How fast do we solve those bugs for the users?

**Bugs Created:** How many bugs does our users get?
{% endhint %}

If we don’t track via dual metrics we’ll have weird scenerios like “We resolve a bug in 1 day on average, but have 1000 bugs created per month. To avoid scenerios like these we use dual metrics.

In this case

* Efficiency is **Bug Resolution Time**
* Effectiveness is **Bugs Created**

**Advance tips:**

* Use week or month as timeframe when tracking these metrics
* If you are constantly hiring, you may want to normalize the effectiveness metric as **Bugs Created per Member**
* The definition of a bug & incident should be clear. You can find more info in [How to Improve Quality?](/guides/how-to-improve-quality#how-should-bugs-be-tracked) section
* Use Issue Lead Time (time from issue creation to issue completed) when calculating Bug Resolution Time.
* In some organizations rather than Bugs Created, they use Bugs Resolved. We suggest keeping it as “Bugs Created”.

## How should bugs be tracked?

Incidents & Product Bugs can be tracked multiple ways. I’ll go over the top ways major organizations track.

*Note: Each organization has different needs and requirements. Feel free to edit the the options in a way it fits your needs.*

*Note2: Below options are based on Jira users. It’s possible to do something similar in all issue management platforms.*

{% hint style="info" %}
Most teams tracks bugs wrongly.&#x20;

Tracking bugs correctly typically requires process changes.
{% endhint %}

### Option #1: For Small Organizations

1. Each issue with `type: bug` is considered as a quality fault
2. Incidents are tracked as `priority: highest` bugs.
3. Production bugs are tracked as `priority: normal/high` bugs.
4. Staging & Development bugs are tracked as `priority: low` bugs.

Benefits

* It’s simple
* Better for small organizations

Cons

* Requires alignment & education across all the team

### Option #2: **For Big Organizations**

1. All incidents SHOULD be created by Incident Management tooling (pagerduty, opsgenie etc.) creates an issue with `type: Incident`
2. All customer issues SHOULD be created by your Support Suite tooling (zendesk, intercom etc.). Customer success team creates `type: Customer Bugs`
3. Any internally catched bugs should be created as `type: bug`

Benefits

* System enforces correct tagging which gets rid of alignment & education
* Better for large organizations

Cons

* It takes change management across DevOps, Product, Engineering, CS teams

## Tactical advice on improving quality

Improving anything goes through the same process

1. Check metrics
2. Identify where to improve
3. Brainstorm on bets
4. Implement the bet
5. Check metrics if the bet resulted in succeed
6. Repeat

{% hint style="info" %}
Action we take should either

1. *Decrease time it takes us to fix a bug (Bug Resolution Time)*
2. *Decrease how many bugs we release to customers (Bugs Created)*
   {% endhint %}

### 1. Check Metrics

You should have board like the following where you track Quality as part of your operational metrics.

<figure><img src="/files/rlGot8YykX7h1F5Xz1ik" alt=""><figcaption></figcaption></figure>

### 2. Identify where to improve

At this point you have 2 options

<details>

<summary>Debug a single issue</summary>

If you click any graph you’ll see all the issues in that week.

<img src="/files/cIVVERvojjRhPPav4l5E" alt="" data-size="original">

</details>

<details>

<summary>Debug high level patterns</summary>

Click on the graph and group by the field you’d like to understand the patterns of

Most common group by options are

1. Team
2. Priority

!![](/files/ij1f7X7UhNbq705qQYIH)

Once you identify where you should be focusing on high level, next step is to find the pattern.

Click on the identified team/priority/group. You’ll see all the related issues

![](/files/lnj5N279Cp2PM4KX5f3f)

From this view, you’ll need to check multiple metadata and try to see what might be the pattern. In this image it seems like a lot of issues get stuck on the QA status (teal column) in Jira board.

Now we have identified where to improve we can go into next step.

</details>

### 3. Brainstorm on bets

Once you understand what the problem is, next step is to brainstorm on potential fixes on the problem.

{% hint style="info" %}
Always look for root cause of the problem. Use following template to find root cause

1. What is the Root cause
2. What is the Customer impact
3. What action can we take to prevent this from happening again?
   {% endhint %}

### 4. Implement the bet

Execute on the idea we have that would fix the bet.

### 5. Check metrics if the bet resulted in succeed

Once we have implemented the fix, we should

1. Check the metrics if it improved either *Bug Resolution Time* or *Bugs Created*
2. Check if we have the same issue happening again.

{% hint style="info" %}
To improve we need to ensure no bug comes twice.
{% endhint %}

### 6. Repeat

If we repeat this action a few dozens times - typically in 2-6 weeks - we’ll see drastic improvements across our engineering quality.


# Sprint Planning

Discover how Haystack uses data to make sprint planning more accurate and efficient.

## Effortless sprint planning with Haystack

{% embed url="<https://www.loom.com/share/59a8801d1fc44f4796cc9807cafe5030?sid=5a9540ea-06a0-433c-991b-9488fa4f7b1b>" %}

Sprint planning often feels like assembling a complex puzzle—one where the pieces keep shifting. Juggling team capacity, creating accurate estimates, and maintaining alignment is challenging. But there's a better way: a smoother, data-driven approach to planning.

#### The Three Pillars of Effective Sprint Planning

Before diving into the tools, let's acknowledge what makes sprint planning work:

1. A refined product backlog
2. Clear product vision, and
3. Reliable data

While the first two come from good product management practices, the third is where Haystack really shines.

#### Making Data Your Sprint Planning Ally

Here's how Haystack transforms your sprint planning from guesswork to precision:

* **Strategic Goal Tracking:** Haystack’s [Epics](https://help.usehaystack.io/features/epics) view gives you a clear picture of your team's progress on strategic initiatives. No more wondering if you're moving the needle on what matters.
* **Past Performance Insights:** The [Retros](https://help.usehaystack.io/features/retrospective) feature shows you exactly how your team has performed in past sprints. With metrics like commitment reliability and scope changes, you can plan with confidence rather than just optimism.
* **Real Capacity Understanding:** Through [Team Metrics](https://help.usehaystack.io/features/team-metrics), you gain deep insights into your team's velocity and work patterns. The detailed breakdown shows not just total story points completed, but also how they're distributed across [investments](https://help.usehaystack.io/features/investments) (type of work) - from features to maintenance tasks. This data-driven approach helps you make informed commitments that your team can consistently deliver.

#### The Bottom Line

Sprint planning doesn't have to be a shot in the dark. With Haystack, you get the data you need to make informed decisions, set realistic expectations, and keep your team delivering consistently. Remember, the goal isn't to pack your sprints to the brim - it's to create predictable, sustainable delivery patterns that keep your team engaged and productive.

Ready to make your sprint planning more effective? Start by looking at your [team's actual performance data](https://help.usehaystack.io/features/team-metrics).


# Daily Standups

Haystack helps development teams run more effective daily standups by providing data-driven insights.

## Better Daily Standups with Haystack

{% embed url="<https://www.loom.com/share/efa6cd2a9e6c41e1ac3dca812fc55e1d?sid=29122de6-3192-4316-be35-84cfdc2c75ee>" %}

### Making Daily Standups Work Better

Development teams need efficient daily standups. Even with well-defined sprint goals, teams face daily challenges like unexpected bugs, changing requirements, and coordination needs that can derail progress.

As teams scale, these challenges multiply. Leaders need to track multiple workstreams, manage dependencies, and ensure clear communication. While traditional standups help, they often lack the structure needed to effectively address these day-to-day issues.

Haystack transforms these daily meetings into data-driven strategic sessions that help you answer 3 critical questions for your daily standups:

1. Are we on track to meet our sprint goals?
2. What's blocking progress?
3. Are priorities clear and resources balanced?

Haystack combines Git and Jira data with intuitive workflows to help you quickly identify blockers and track sprint progress. Here are the key capabilities:

* Track sprint progress with [real-time activity changes](https://help.usehaystack.io/features/issues)
* Identify and resolve blockers through [alerts](https://help.usehaystack.io/features/alerts)
* Tailor sprint direction with [workflow insights](https://help.usehaystack.io/features/issues#h_f7d69cca4d)

Haystack empowers teams to transform daily standups from basic updates into strategic discussions that drive better engineering outcomes and accelerate sprint progress.


# Retrospectives

How Haystack helps run more effective engineering team retrospectives that drive real improvement.

## Effective retros with Haystack

{% embed url="<https://www.loom.com/share/5dda7a4a80bc482191c9a013a5a55b0c?sid=7f88c4fe-a327-4539-bd27-680eb5d596d6>" %}

Retrospectives are crucial for team improvement and growth, but running them effectively can be challenging - especially with distributed teams, varying engagement levels, and the need to balance constructive criticism with team morale. Here's how to leverage these capabilities to make retrospectives more impactful and drive real change.

#### The Three Pillars of Effective Retrospectives

A successful retrospective stands on three fundamental pillars:

* **Collaboration:** Ensure every team member contributes their insights and experiences, leading to a comprehensive understanding of challenges and solutions.
* **Outcome Focus:** Set concrete, measurable objectives that teams can track and achieve, rather than vague goals.
* **Clear Action Plans:** Define responsibilities, deadlines, and success metrics to maintain accountability and fairness.

#### Preparing for Success

Haystack gives you powerful insights before retrospectives:

1. [Release notes](https://help.usehaystack.io/features/release-notes) provide clear visibility into your team's completed work and achievements
2. [Retrospective view](https://help.usehaystack.io/features/retrospective) reveals patterns in scope changes and resource allocation
3. [Completion rates ](https://help.usehaystack.io/features/retrospective#h_644d874c5f)show your team's reliability and highlight areas for improvement

#### Key Metrics to Focus On

During the retrospective, pay attention to these crucial metrics in Haystack:

* [Issues Completed](https://help.usehaystack.io/features/retrospective#h_644d874c5f): Track the percentage of completed issues and analyze any incomplete tasks.
* [Sprint Planning Effectiveness](https://help.usehaystack.io/setup/teams/sprint-success-metric): Monitor the ratio of planned vs. injected issues to optimize future sprint planning.
* [Investment Breakdown: ](https://help.usehaystack.io/features/retrospective#h_e1bf47e112)Understand how your team's time was distributed across different types of work.
* [Epic Progress](https://help.usehaystack.io/features/epics): Review progress on longer-term goals and strategic initiatives.

Effective retrospectives go beyond routine meetings—they drive continuous improvement through data-driven insights and structured processes. Success depends on consistent follow-through and regular check-ins on action items to improve team performance.

Use Haystack to track progress, maintain accountability, and tackle challenges systematically while celebrating wins.


# Identify Bottlenecks

Haystack helps engineering teams identify and resolve workflow bottlenecks through real-time analytics and alerts.

## Identify Bottlenecks with Haystack

{% embed url="<https://www.loom.com/share/2d9276ba90624fdea3982ea37a62b87f?sid=f7f70e9f-caa4-4a85-b170-b4fd6874ab49>" %}

Engineering teams often find themselves running in circles instead of shipping features. Haystack helps pinpoint exactly where work gets stuck, whether it's lengthy code reviews or complex handoffs. Instead of waiting for retrospectives to discover bottlenecks, teams can access real-time insights to maintain smooth workflows and consistent shipping - preventing small delays from turning into missed deadlines.

#### Understanding Historical Patterns

Every engineering team has its unique story, workflows, and challenges. Before drawing conclusions, it's essential to examine what your specific data reveals about your team's patterns. Start with three [fundamental metrics](https://help.usehaystack.io/features/list-of-all-metrics):

* Issue cycle time
* Bug resolution time
* Issue time in status

#### Setting Up Early Warning Systems

Once you understand your team's baseline Once you understand your teams benchmarks on these metrics, you can:

* [Configure SLAs](https://help.usehaystack.io/setup/teams/slas) for bugs and time-bound issues
* [Configure Issue risks](https://help.usehaystack.io/setup/teams/risks) for all types of work
* [Configure PR risks](https://help.usehaystack.io/features/pull-requests) including review time and activity metrics

#### Taking Action on Insights

Haystack provides real-time visibility into tasks that need attention through:

* Visual alert indicators for issues exceeding thresholds
* Detailed context for each flagged item
* Easy filtering options to focus on at-risk issues

#### Best Practices for Success

* Configure meaningful alerts that balance urgency with team capacity
* Use data to drive discussions, not assign blame
* Focus on steady, continuous improvement

With these tools and practices in place, you'll be better equipped to keep your engineering team moving smoothly and shipping features on time.


# Changelog

See what’s new

## Surveys (Beta)

January 8, 2025

<figure><img src="/files/GxRFG0csPflh9F8Lhbqm" alt=""><figcaption></figcaption></figure>

Developer Experience Surveys (Beta) enables teams to gather valuable feedback about their development processes. This new feature combines with our existing metrics to create a complete picture of team health and productivity. Managers can now track both data-driven measurements and team sentiment in one place.\
\
Interested teams can [reach out to support](https://growth.usehaystack.io/n/schedule-booking/370714/W9xn7L) to get started.

### MS Teams Integration (Beta)

Haystack’s MS Teams integration sends real-time alerts for blockers, progress, risks, and SLAs. Alerts include issue status, bug SLA risks, PR link issues, sprint overcapacity, mid-sprint reviews, cycle completions, release notes, and epic completions.\
\
Interested teams can reach out to support to have it enabled. To integrate, go to `Settings > Integrations > Alerts` and click `Connect MS Teams`.

### Dynamic End Date in Reporting

You can automatically update the 'End Date' for your reports. By setting a fixed 'Start Date' (e.g., October 1st), the 'End Date' will dynamically adjust to today's date.

Dynamic end date is available in [Metrics](https://delivery.usehaystack.io/hub/metrics) and [Reports](https://delivery.usehaystack.io/reports)

<figure><img src="/files/CqioHBgBVukz2rQ89F6o" alt=""><figcaption></figcaption></figure>

**Improved**

* `Expanded Date Range for Epics` (Beta): The `Epics` view can now include the option to filter data by the past quarter. Reach out to our support team to enable this functionality.
* `Improved User/Deployments Management`: A search box has been added to manage `Users` and `Deployments`, along with the ability to change a user's full name and sort by name or access level.

***

## **Sprint Completion Rate metric without injections**

**November 19, 2024**

Now you can track Sprint Completion Rate excluding injections, which we called Commitment Reliability.

We also added Commitment Reliability (Issues) and Commitment Reliability (Points) as a metric option to Metrics and Reports.

Go to **team settings -> Sprint success metric,** to enable tracking Commitment Reliability. [Learn more](#sprint-success-metrics)

**New**

* `User settings` added ability to change user names
* `User settings` added search through the list of invited users
* `Deployments` added search through the list of services

***

## Q3 summary

**October 9, 2024**

<figure><img src="/files/9giA8wSlDx2UKz55D6vq" alt=""><figcaption><p>Quarterly summary</p></figcaption></figure>

We have compiled a review of your key accomplishments from the last quarter. You can view it [here](https://delivery.usehaystack.io/performance-report).

### Filter by no value

You can now filter by property values that are empty. This feature is available for all properties that can have empty values across the app.

<figure><img src="/files/y2iNXSFYTSSuoV28JH6f" alt=""><figcaption><p>Filter issues that don't have labels</p></figcaption></figure>

**Improveed**

* `Epics calculation` Epics are included in the metrics and reports calculation even if they are not added to a sprint.

***

## Hide GIFs from alerts

**September 19, 2024**

<figure><img src="/files/F7kEA5ApJSz37wTHjiXx" alt=""><figcaption><p>Hide GIFs in Alerts </p></figcaption></figure>

While GIFs in alerts provide more fun during your working hours, we realized that if you use Alerts for a long time, they become less exciting and more of a distraction. If you want to hide GIFs from the UI, do it in T**eam Settings -> Alerts -> Show GIFs** (at the bottom of the page).

**Improved**

* `Settings` we have hidden the "Show member's work outside of the board" in UI and enabled it by default.
* `Integrations` new UI when you integrate Jira. Now it should be easier to understand how to integrate your Jira.

***

## Q2 Summary improvement

**September 12, 2024**

**Improved**

* `Q2 Summary` We now hide the epics slide in the Q2 summary if you didn’t use epics for the past quarter

***

## Labels for PR metrics

**September 10, 2024**

**New**

* `PR metrics labels` Added labels for grouping PR metrics

**Improved**

* `Exclusions` We now hide the excluded information when 0 issues are excluded

**Fixed**

* `Data fetching` Fixed an issue where data fetching was frozen for some users during onboarding
* `Investments setup` Fixed an issue where the priority field would be empty if "High" or "Highest" priorities weren't found in Jira, which broke the investments setup
* `Slack notifications` Fixed an issue that caused removed Slack notification recipients to reappear when multiple entries were removed in quick succession

***

## Faster log in

**September 3, 2024**

**Improved**

* `Performance` Your account now loads faster after logging in
* `Onboarding` Large teams (100+ engineers) can now set up their account without scheduling a call
* `SLAs settings` We removed "time-sensitive issues" from the description in SLA settings to reduce confusion

**Fixed**

* `Investments` Fixed a bug where manually selected investment categories were being overwritten by investment rules