
List of All Metrics
Here are the available metrics within Haystack
Issue
Issue Cycle Time
Total time an issue spends in the "In-Progress" status category
Issue Lead Time
Time from issue creation to the issue being moved to the "Done" status category
Issue Time in Status
Time an issue spends in each status category, broken down by status
Issues Created
Number of issues created
Issues Completed
Number of issues moved to the "Done" status category
Points Completed
Number of story points associated with issues moved to the "Done" status category. Issues without story points are counted as 0.
Issues Injected
Number of issues added to the sprint after it started
Points Injected
Number of story points associated with issues injected into the sprint. Issues without story points are counted as 0.
Issues Completed Per Member
Number of issues moved to the "Done" status category per team member
Points Completed Per Member
Number of story points moved to the "Done" status category per team member. Issues without story points are counted as 0.
Issues Created Per Member
Number of issues created per team member
PR
PR Review Time
Time from pull request open to merging. Time in draft states are excluded from review time calculation.
PR Review Time Breakdown
Breakdown of review time includes three metrics: first response, rework, and idle completion time. Sum of these three equals the review time metric.
First Response Time
Time from pull request open to the first comment. If no comments exist, first response time is 0.
Rework Time
Time from first comment to last commit. If no comments exist, pull request open is considered the start time of rework time
Idle Completion Time
Time after rework is completed to merging a pull request
PRs Merged
Number of pull requests merged
PRs Unlinked
Number of pull requests unlinked to a Jira issue
PRs Merged Per Member
Number of pull requests merged per member
Sprint
Sprint Completion Rate (Issues)
Number of issues completed over total number of issues at the end of the sprint
Sprint Completion Rate (Points)
Number of points completed over total number of points at the end of the sprint
Commitment Reliability Rate (Issues)
% of issues completed out of the total sprint scope (excluding injected issues)
Commitment Reliability Rate (Points)
% of story points completed out of the total sprint scope (excluding injected issues)
Deployment
Deployments Count
Number of deployments made
Customizations
You can group by or filter any metric based on their metric type.
Issue or Sprint
Assignee
Priority
Issue Type
Label
Project
SLA Status
Investment
Epic
Story Points
Custom JIRA Field
Team
PR
Author
Reviewer
Label
Repository
Team
Deployment
Service
Environment
Repository
Team
FAQ
Can I track DORA metrics?
Haystack gives building blocks for each DORA metric. You'll need to create your own dashboard.
Change Lead Time (Issue Cycle Time)
Deployment Frequency (Deployments Completed)
Mean Time to Recovery (Issue Lead Time)
If you are in the search of what metrics to track, we highly recommend checking the following posts.
When to use average vs 85th percentile calculation method?
When deciding between using the average or the 85th percentile for calculations, consider these points:
Averages are useful when your data is consistent and you don't expect outliers. However, they can be distorted by extreme values.
85th Percentile is better for data with potential outliers. It gives a value below which 85% of the data falls, reducing the impact of extreme values.
For time-based metrics, which often have outliers, the 85th percentile is usually more appropriate. This method provides a clearer view of typical performance. Use the 85th percentile for metrics like:
Issue Cycle Time
Issue Lead Time
PR Review Time
Review Time Breakdown
First Response Time
Rework Time
Idle Completion Time
Why 85th percentile?
We'll be focusing on Issue Cycle Time metric and its distribution, but the base logic can be applied to all metrics mentioned above.
Issue Cycle Time is the total time spent in in-progress status category. Due to the nature of how developers work, we can see Issue Cycle Time being a long tail distribution:

If we use the average Issue Cycle Time, we will get 1.62 days.
Average is a good indicator of understanding the total time spent and if the team is getting better using trends.
However, if we want to answer the question "How long would a new issue take?", it will fall short of answering this question. Average is skewed by lots of short few minutes or long issues.
If we look at median, we can say with 50% confidence that this issue will take 0.91 days. Using the median is less practical since we will be ignoring all the bigger issues.
To answer the question, "how long would a new issue take to resolve?" we should use 85th percentile. Essentially this means that with 85% confidence, we can say that the given issue will be completed in 3.26 days.
Using 85th percentile gives us:
Practically point of view on how long it takes for the issue to be completed
The result doesn't get skewed by lots of shorter issues which most likely have lower business value.
Conclusion
At Haystack, we want to give more actionable insights and decrease the amount of noise there is in the data. Looking at 85th percentile is an industry-standard among Product Managers.
We recommend using 85th percentile when calculating time metrics allowing you to understand and take action on your software delivery.
Can I see Mean Time to Recovery (MTTR)?
Recommended Read: How to Improve Quality
Option 1: Track via Haystack
Haystack has a tight integration with Jira, but not with issue trackers. This means you'll need to utilize Jira to be able to track it inside Haystack.
This is also a best practice. All work that engineering team does should be tracked in their issue trackers.
1. Create Jira Issues
Automatically create issues in Jira using OpsGenie
Automatically create issues in Jira using Pagerduty
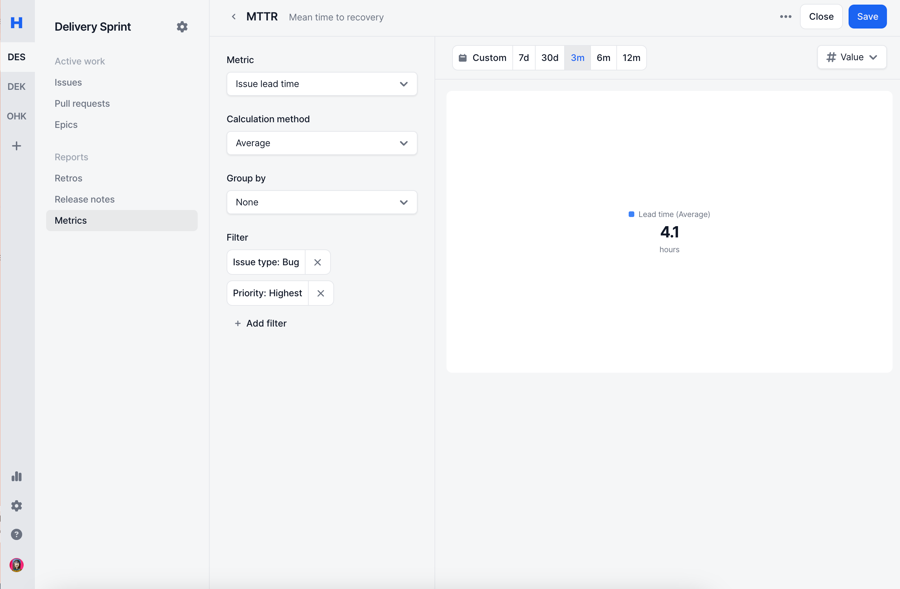
2. Create Graph In Haystack
Once you have created a consistent way to create tickets inside Jira whenever incident happens, next step is to track MTTR.
Go to Reports page
Click New Graph icon
Select
Issue Lead Timeas the metricSelect the filters that represents an incidents
Typically teams use
Issue Type: Bug&Priority: HighestIssue Type: Incident
Select the visualization type
Use
valueto see the raw numberUse
lineto see it over time
Click Save
Option 2: Track via Incident Management Systems
MTTR is a commodity metric meaning almost all Incident Management Systems support it built-in.
Below are the links for most common Incident Management Systems
Can I see Change Failure Rate (CFR)?
CFR is a metric that can be phrased as "Percentage of our deployments caused incidents".
As long as you have the definition of an incident, you will be able to track how CFR using either Issue completed or Deployments count filtered by an indicator that represents incidents.
Want more actionable metrics for quality? Checkout How to Improve Quality?
Can I see Development Time metric?
No.
As an alternative you can use Issue time in status metric which would give more reliable data.
Development time metric typically refers to time it takes to open a pull request. We have deprecated this metric as it was an unreliable metric. It's only available for older accounts.
There are 2 ways this metric can be calculated which both has reliability issues:
JIRA: Mixing timestamps of Version Control & Jira for the start and end of development time leads to large inconsistencies in the data; especially given unlinked pull requests, developers moving an issue to in-progress state chaoticly and other outliers that reduce data quality.
Version Control: Mixing timestamps of Version Control & Git for the start and end of development time leads to large inconsistencies in the data; especially given git squashing where it's easy to have 0 development time for some developers who uses this method.
How do I ensure if the metrics are correct?
You can always understand the raw data of any metric by clicking to the graph. A drill-in modal will appear with all the data points that was used to calculate that metric.
How are my team metrics calculated?
The following settings effect how the teams metric is calculated
If Kanban: Shows all issues in your board based on your settings
If Sprint: Shows all issues in your sprint based on your settings.
Note: If an issue is in-progress but not in your sprint, Haystack will not show that issue.
Sprint Filter (only for sprint based boards)
You can always understand the raw data of any metric by clicking to the graph. A drill-in modal will appear with all the data points that was used to calculate that metric.
Do PR metrics count unlinked PRs?
Yes. All Pull Requests merged by team members will be included in calculations.
If you want to check specifically unlinked PRs, check PRs unlinked metric.
Are Tasks/Stories/Epics/Subtasks calculated in Issue based metrics?
Haystack does an implicit filter on metrics to ensure the data looks correct with an initial glance.
Subtask and Epic issue types are not calculated part of any metric. All other issue types would be included in the metrics.
You can validate this by using "Issue Type" filter.
Does Haystack exclude weekends and holidays?
Haystack does not exclude any particular date ranges like holidays, PTO, weekends, etc.
While initially this may feel like your metrics are artificially increased, we think about metrics from the perspective of the customer. In this case, the customer is still waiting during the weekends and the increased metrics continues to be a great signal on where bottlenecks might lie.
Last updated