> For the complete documentation index, see [llms.txt](https://help.usehaystack.io/llms.txt). Markdown versions of documentation pages are available by appending `.md` to page URLs; this page is available as [Markdown](https://help.usehaystack.io/features/team-metrics.md).
# Team Metrics
{% hint style="info" %}
Looking to report across multiple teams? Checkout [Flexible Reports](/features/flexible-reports.md)
{% endhint %}
[Metrics page](https://delivery.usehaystack.io/team/metrics), gives each team a dedicated place to have their own metrics.
All graphs created inside Metrics page will automatically be filtered by that teams work allowing you to easily see what's important for you.
## Add Widget
{% hint style="info" %}
Read [How to create a Report](/features/customizable-widgets.md)
{% endhint %}
You can add a new Report in 2 ways
1. **Add Report Button**
2. **Add Content Button**
Once you click on them, you'll see 2 options
1. **Add report**: Adds flexible reports (read more on [Reports](/features/team-metrics.md))
2. **Add note**: Notepad that supports richtext editor.
Below is an example how both are being used together.
## Update Widget Order
If you hoverover any content you'll see 3 lines logo. Holding this will allow you to rearrange the order of the graphs
## Update Filters
Easily filter all boards using your selected date range.
Alternatively, you can make the 'End Date' dynamic in your reports by setting a fixed 'Start Date' (e.g., January 1st). The 'End Date' will automatically adjust to always reflect today's date.
To Enable Dynamic Date Filtering:
1. Locate the 'Since' slider button in date filter settings.
2. Toggle the slider to enable the feature.
3. Set your desired 'Start Date' as input.
**Notes**:
* You need to press "Save" button for the filters to take action.
* Once saved, all the graphs date filters will be updated individually.
* Default - the board will show each graphs original date filter supporting different time ranges being shown in a single board.
## Share Board
You can share the whole board with a few clicks.
The following options are supported
* **Export as CSV**: Shares each boards data in CSV format.
* **Export as PNG**: Takes a screenshot of the board in png format.
* **Copy Link**: Shares the board link. You can also share the link from the browser.
* *Note: Only people who has access to Haystack can see the shared links*
## Examples
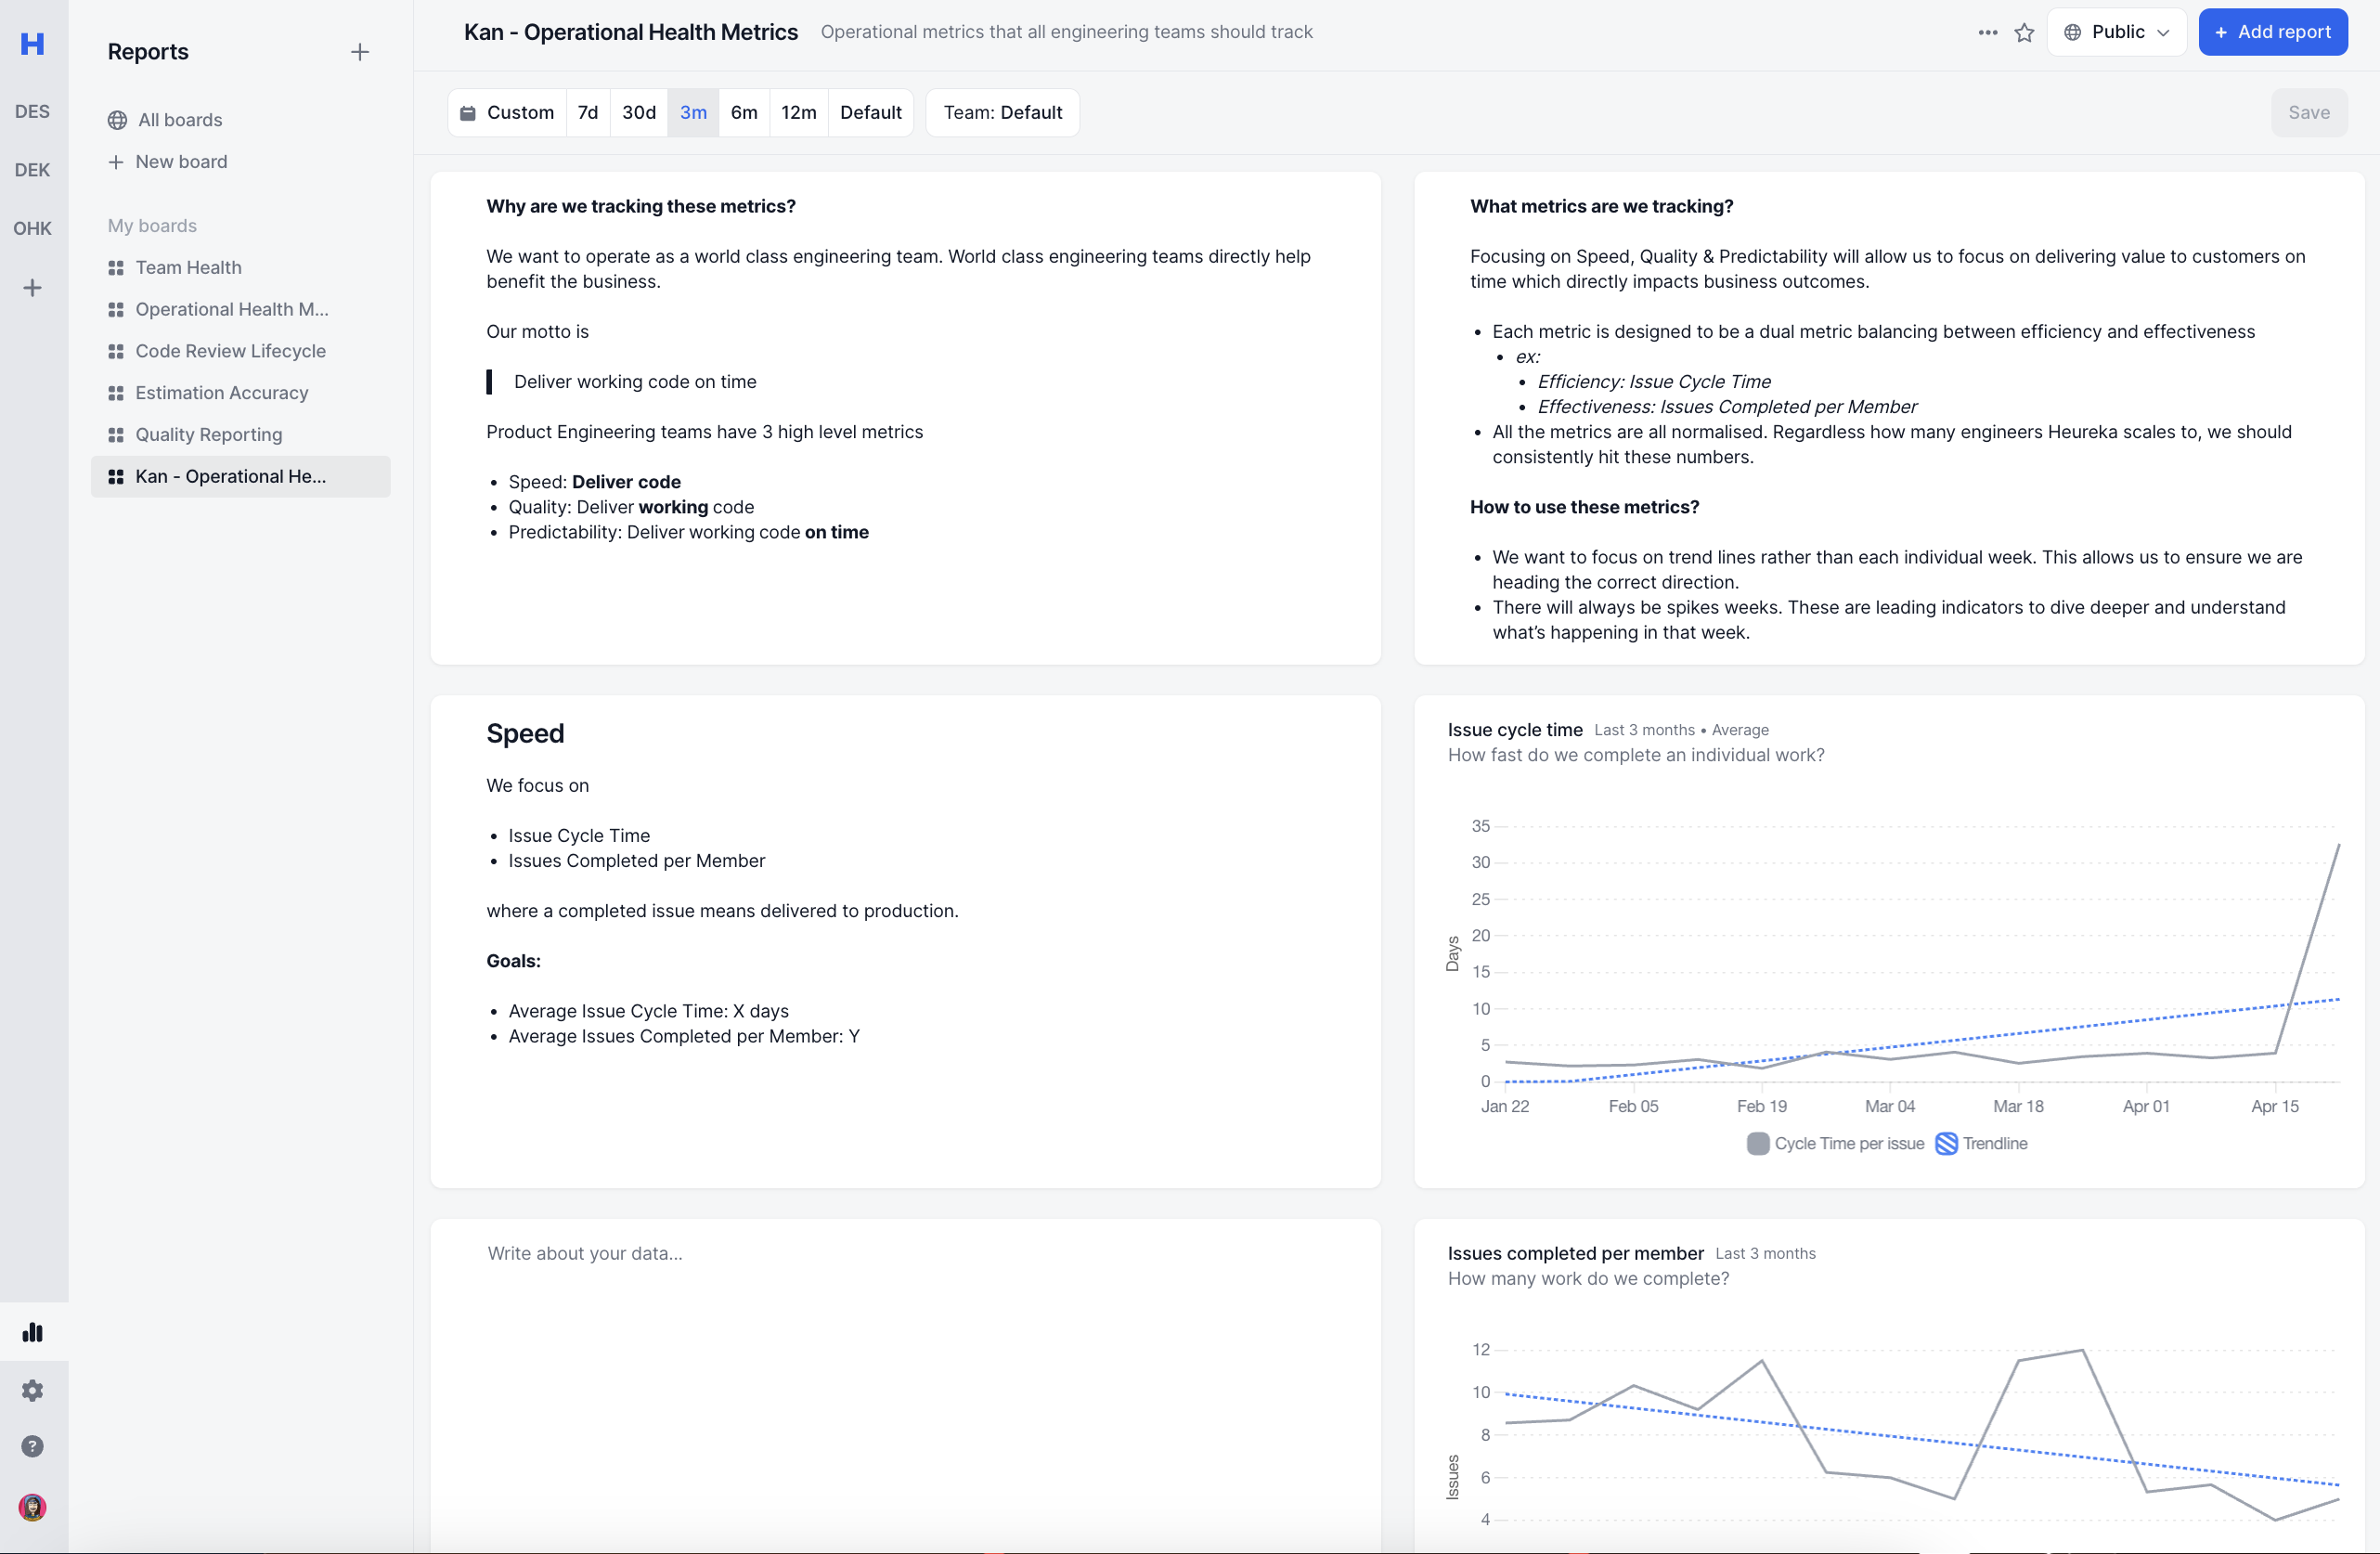
### Operational Metrics Board
You can read more on [First Principles of Engineering Metrics](https://www.notion.so/usehaystack/First-Principles-of-Engineering-Metrics-1b4ae891164144fcb8c04a264849a3c3?pvs=4)
**Speed:**
* Issue Cycle Time
* Issue Completed
**Quality:**
* Issue Lead Time
* filter by bugs
* Issue Completed
* filter by bugs
**Predictability:**
* Sprint Predictability Rate
* Issue Completed
* group by Investments
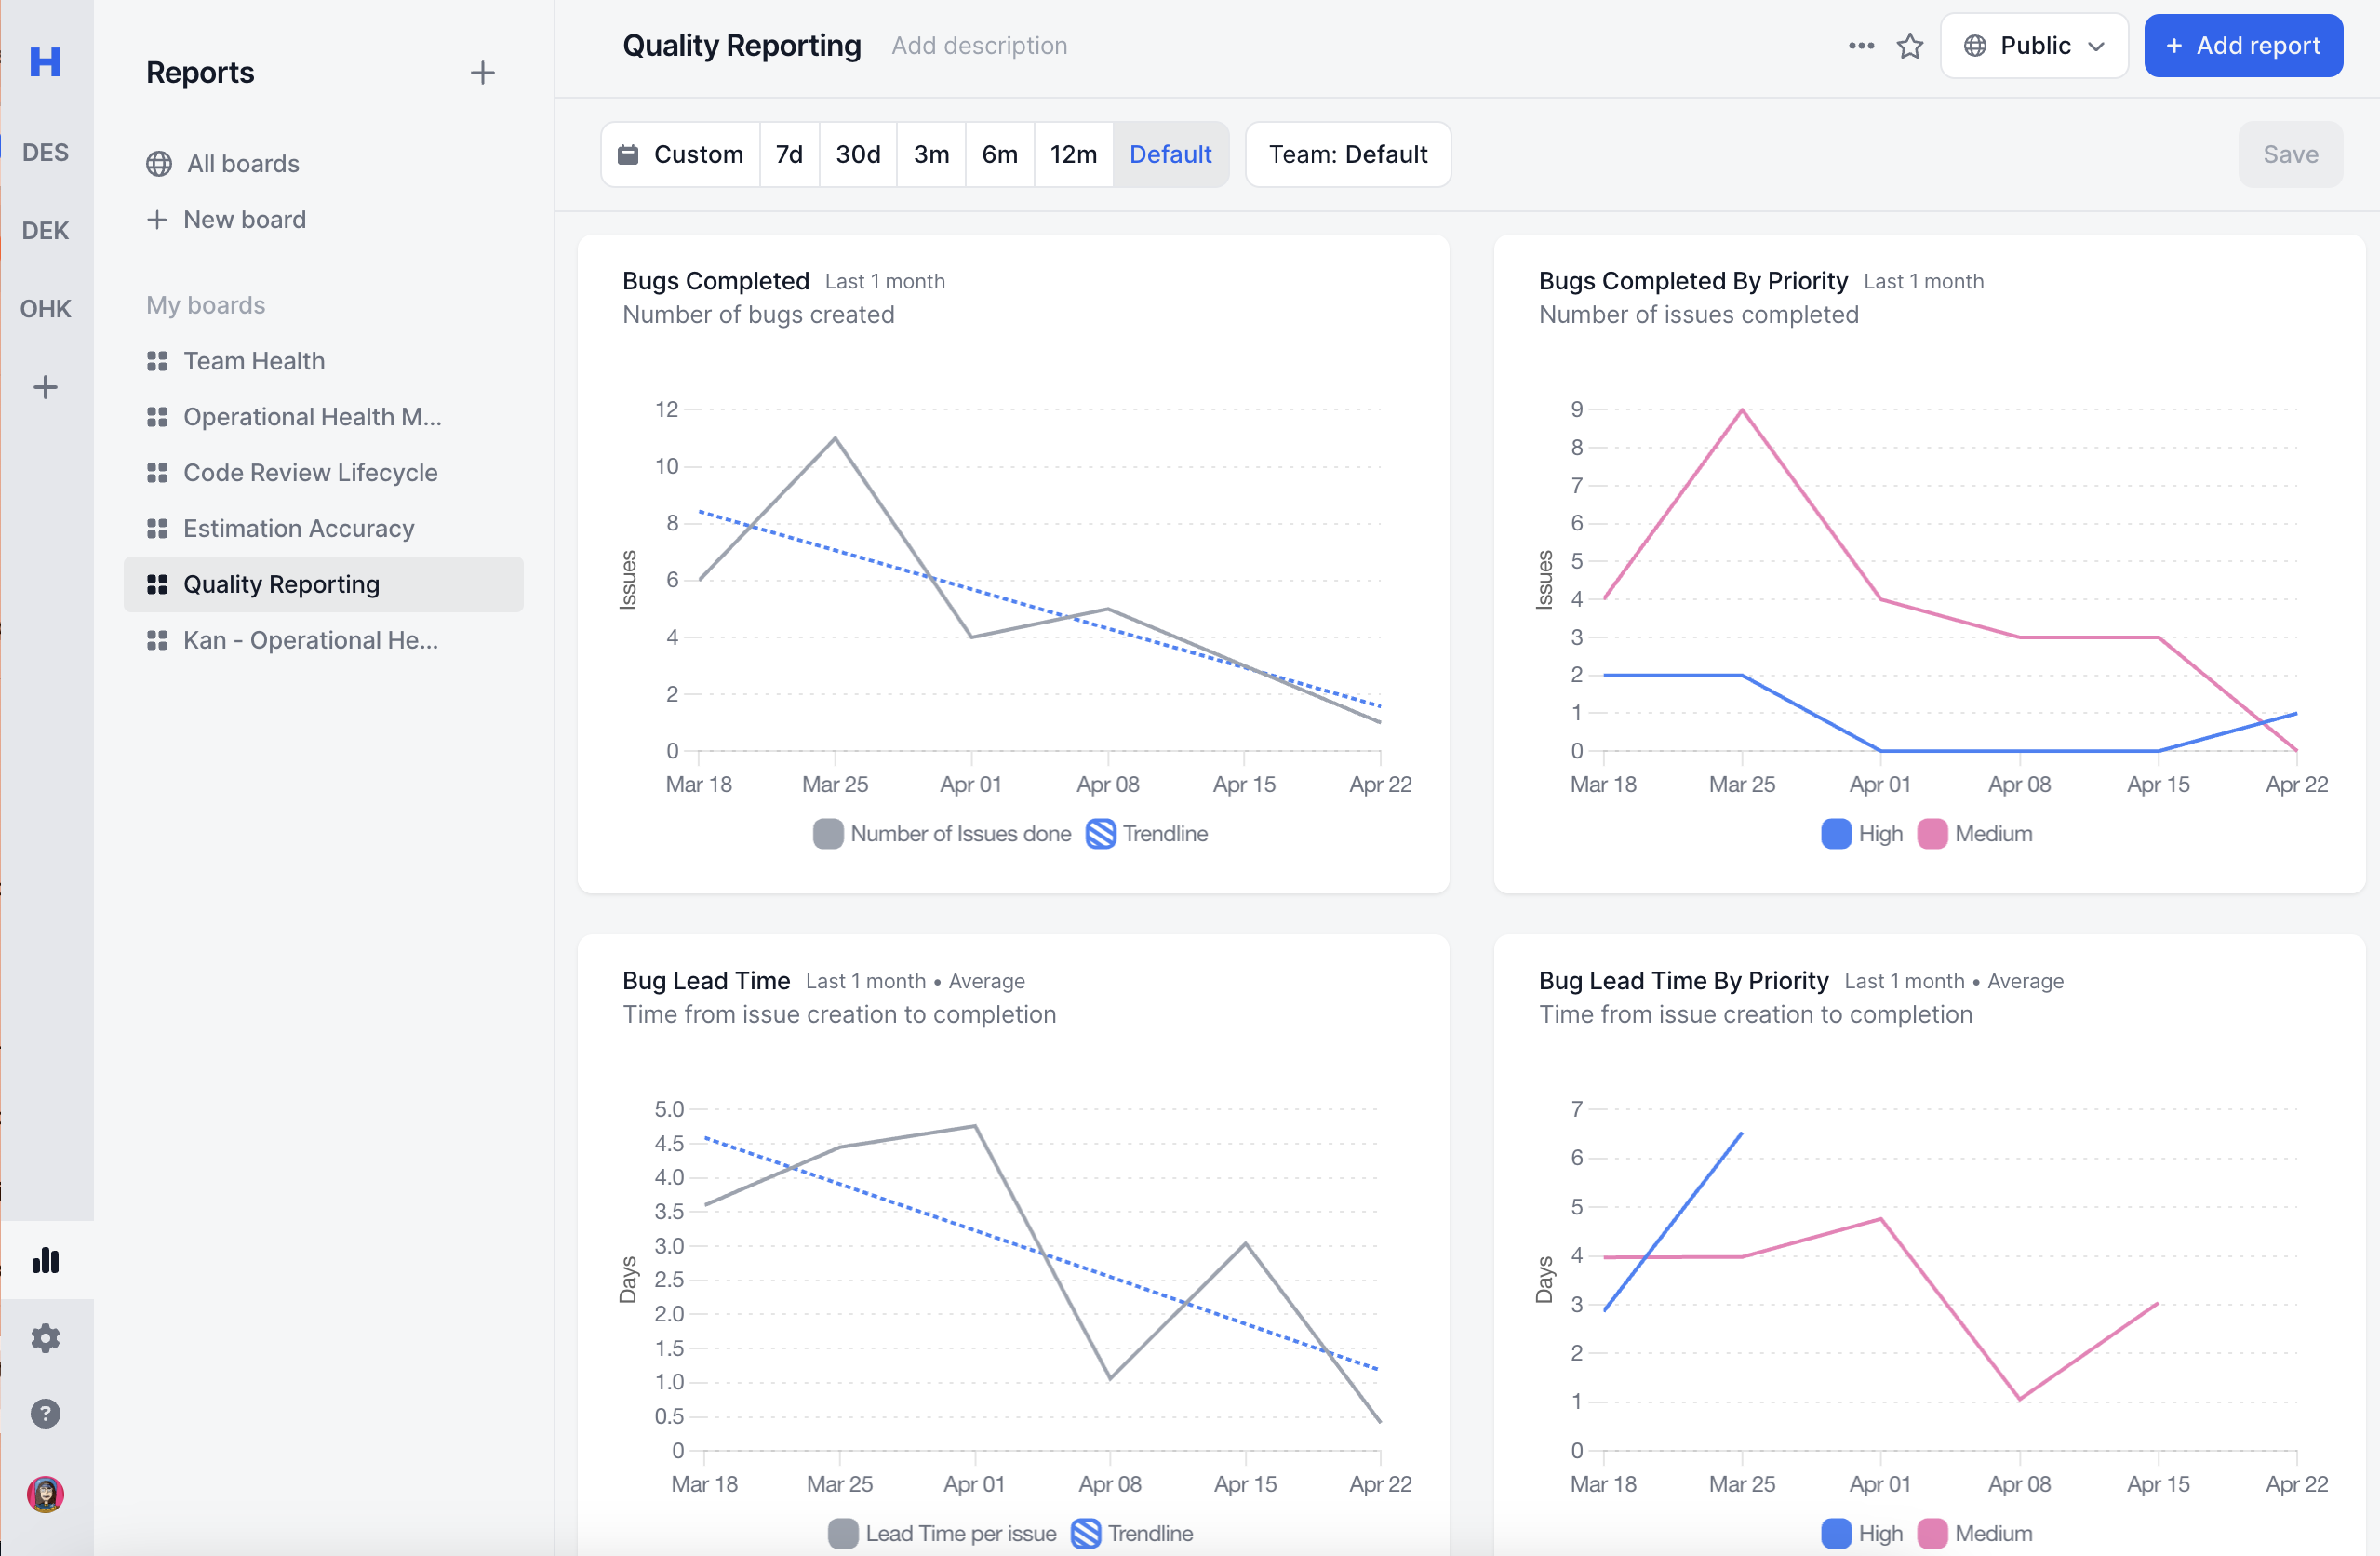
### Quality Board
You can read more on [How to Improve Quality](https://www.notion.so/usehaystack/Quality-for-Product-Engineering-Teams-13a9f9ec734a4f179b786fcaf7310bc5?pvs=4).
**Main Metrics**
* Issue Lead Time
* filter by bugs
* Issue Completed
* filter by bugs
**Debugging Metrics**
* Issue Lead Time
* group by teams
* filter by bugs
* Issues Completed
* group by teams
* filter by bugs
* Issue Lead Time
* group by priority
* filter by bugs
* Issues Completed
* group by priority
* filter by bugs
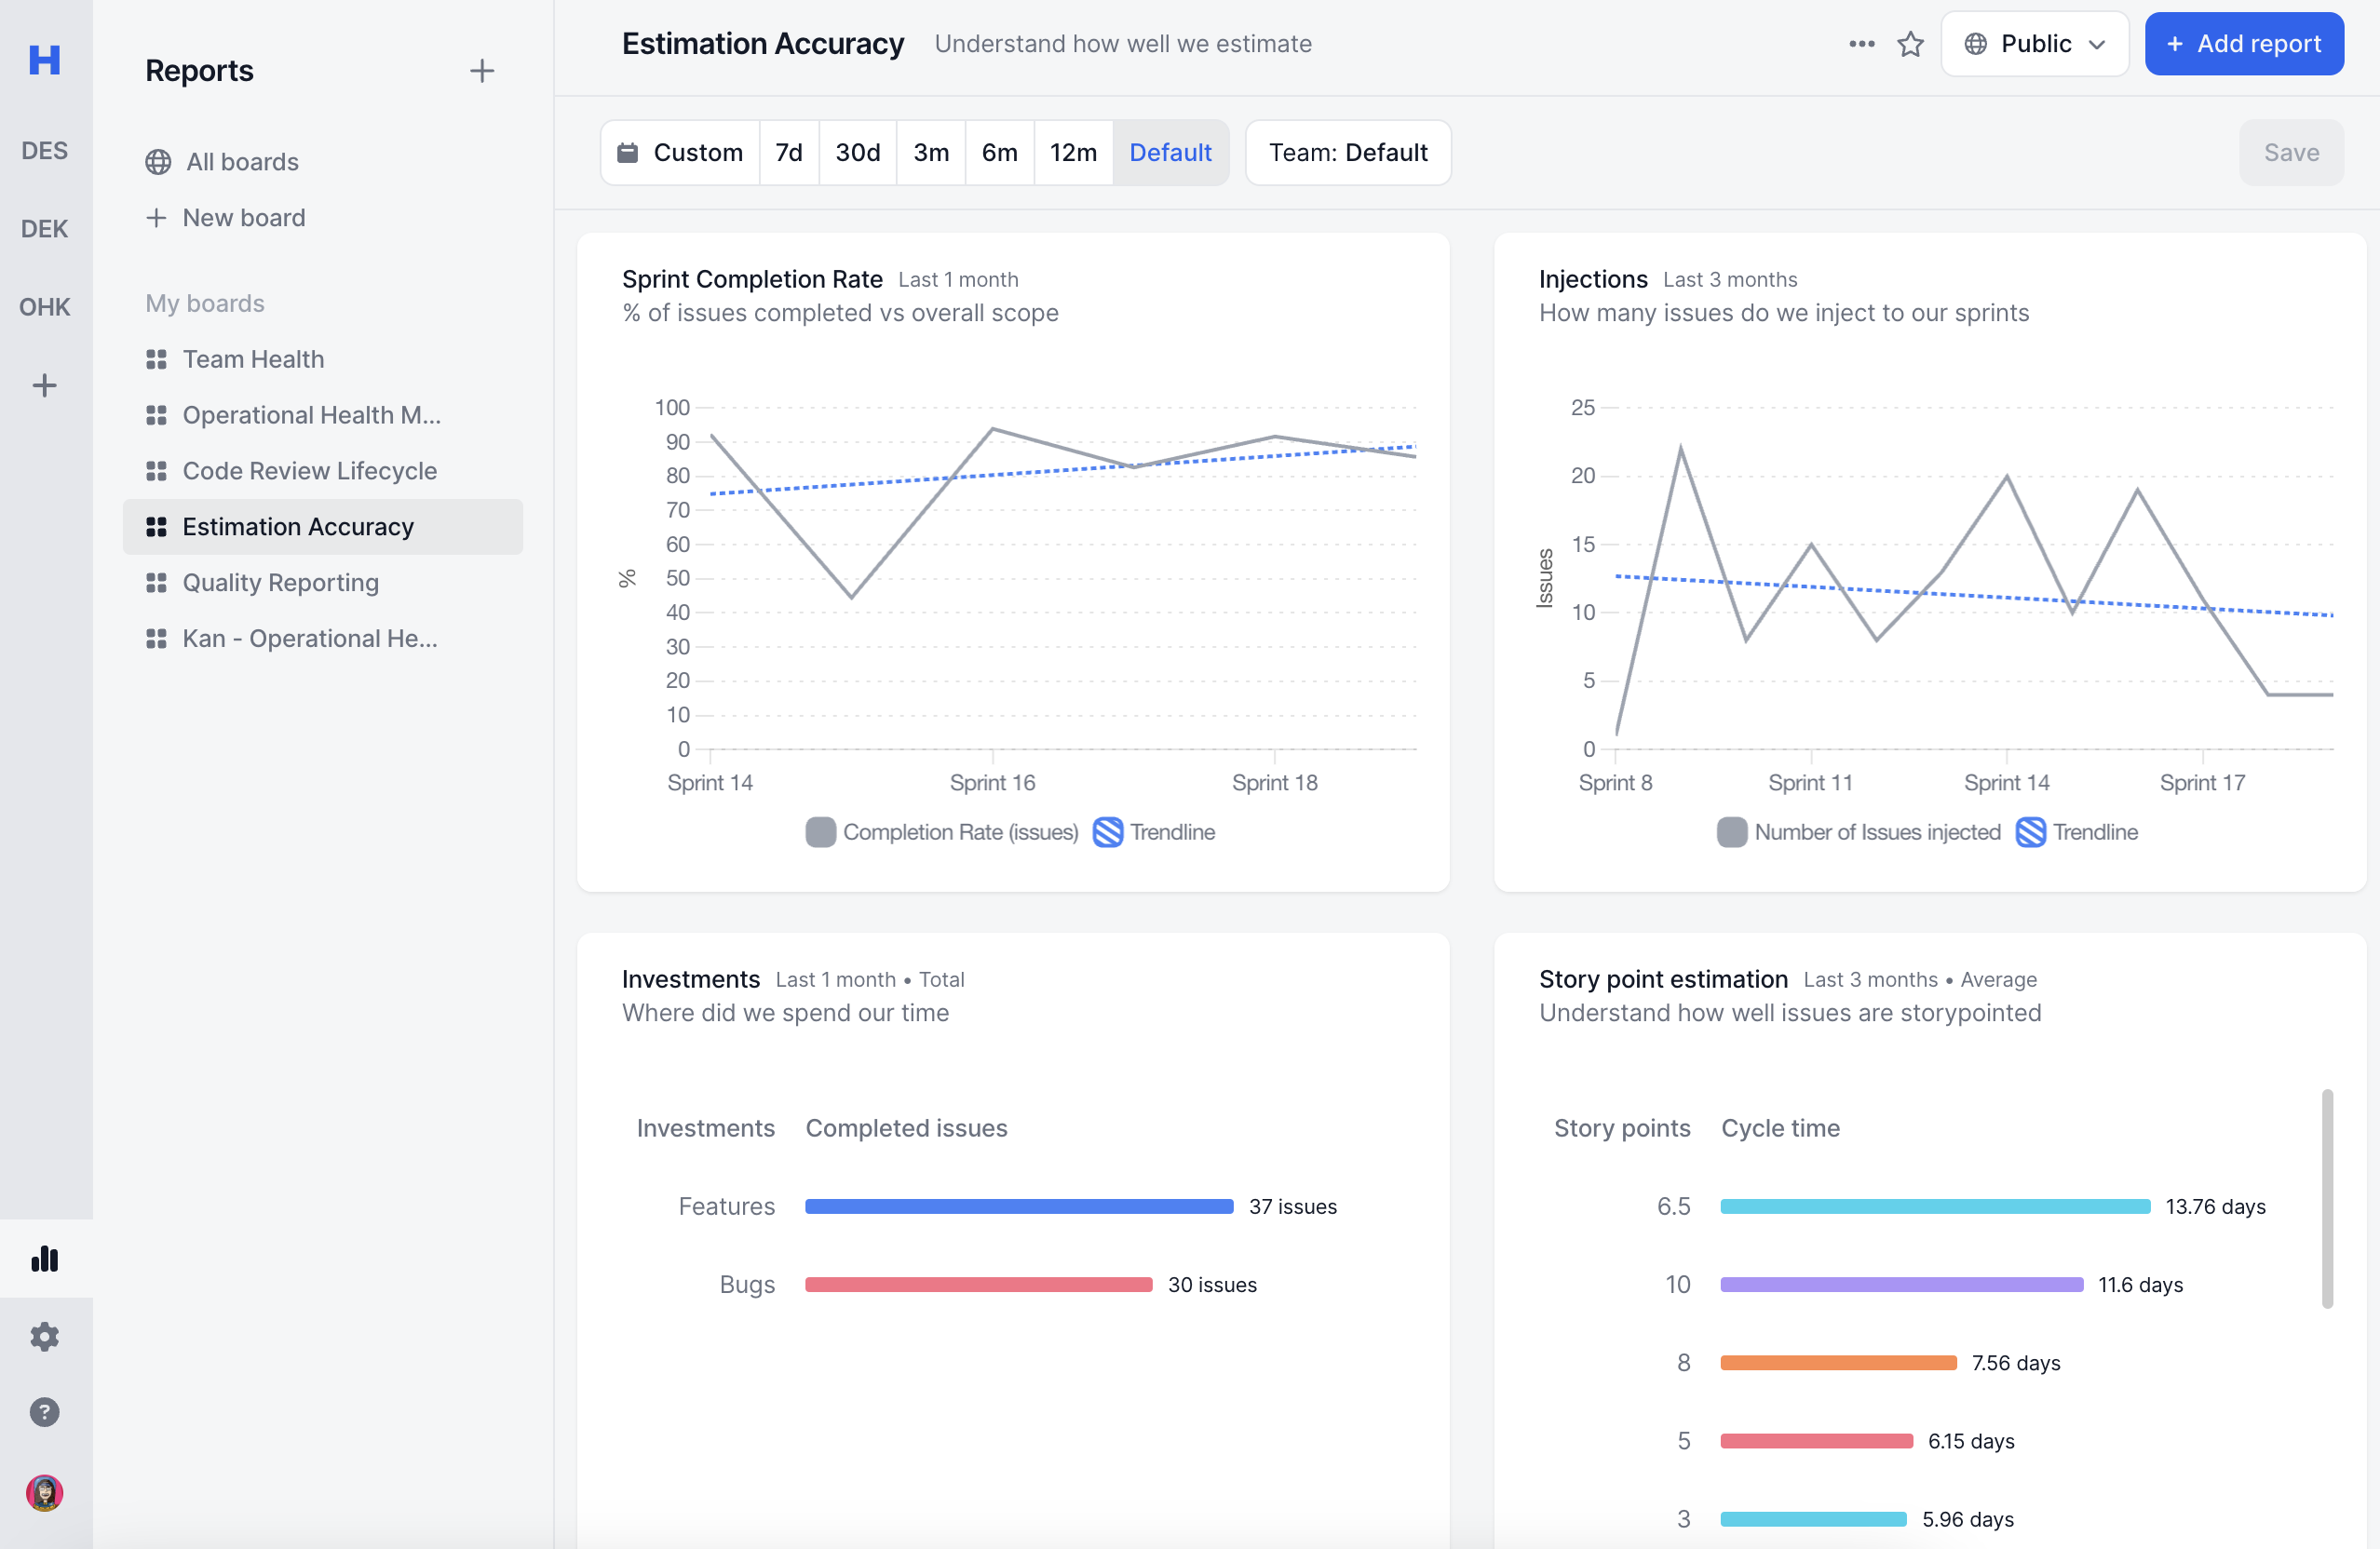
### Estimation Accuracy
**Main Metrics**
* Sprint Predictability Rate
**Debugging Metrics**
* Issues Completed
* Group by Investments
* Issue Cycle Time
* Group by Story points
* Issues Injected
* PRs unlinked
## FAQ
### What’s the difference between Team Metrics and Reports pages?
[Team metrics](https://delivery.usehaystack.io/team/metrics) is purposefully built for a single team. This gives teams a dedicated place to review metrics that are most relevant to that particular team.
[Reports](https://delivery.usehaystack.io/reports) provides flexible reporting across all teams.
### Do you track X metric?
See this page for a list of [all metrics](/features/list-of-all-metrics.md) and calculations.
### How is X metric calculated?
See this page for a list of [all metrics](/features/list-of-all-metrics.md) and calculations.
### Can I see this per X?
Yes, most likely.
You can group by any field in Github or Jira. For Github Metrics (i.e. Review Time, PRs Merged, etc) you’ll be able to group by any field in Github. Similarly for Jira Metrics (i.e. Cycle Time, Sprint Completion, etc) you’ll be able to group by any field in Jira.
For more info check [Add Reports](/features/customizable-widgets.md)
### Can I filter to only contain X?
Yes, most likely.
You can filter by any field in Github or Jira. For Github Metrics (i.e. Review Time, PRs Merged, etc) you’ll be able to filter by any field in Github. Similarly for Jira Metrics (i.e. Cycle Time, Sprint Completion, etc) you’ll be able to filter by any field in Jira.
For more info check [Add Reports](/features/customizable-widgets.md)
### What reports should I track?
See this page for a list of all our favorite boards.
### Can I duplicate an existing board?
You can duplicate an existing board only in [Reports](https://delivery.usehaystack.io/reports) page.
In [Team metrics](https://delivery.usehaystack.io/team/metrics) page, you cannot duplicate or copy a board from one team to another.
### Can I update all reports on a board?
Yes, simply update the filter at the top of any board. This will filter all reports on that board. You can additionally save your filter if you’d like to change the board’s default filters.
---
# Agent Instructions
This documentation is published with GitBook. GitBook is the documentation platform designed so that both humans and AI agents can read, navigate, and reason over technical content effectively. Learn more at gitbook.com.
## Querying This Documentation
If you need additional information that is not directly available in this page, you can query the documentation dynamically by asking a question.
Perform an HTTP GET request on the current page URL with the `ask` query parameter, and the optional `goal` query parameter:
```
GET https://help.usehaystack.io/features/team-metrics.md?ask=&goal=
```
`ask` is the immediate question: it should be specific, self-contained, and written in natural language.
`goal` is optional and describes the broader end goal you are ultimately trying to accomplish on behalf of the user. GitBook uses it to tailor the answer towards what is most useful for that goal.
The response will contain a direct answer to the question and relevant excerpts and sources from the documentation.
Use this mechanism when the answer is not explicitly present in the current page, you need clarification or additional context, or you want to retrieve related documentation sections.