Customizable Widgets
Learn how to create a new widgets
In this article we'll go over details on how to create a Widget.
There are 2 places you can add Reports
Team metrics (check Learn how to use Team metrics article)
Reports (check Learn how to use Reports article)
Below are all the ways you can create a new report.
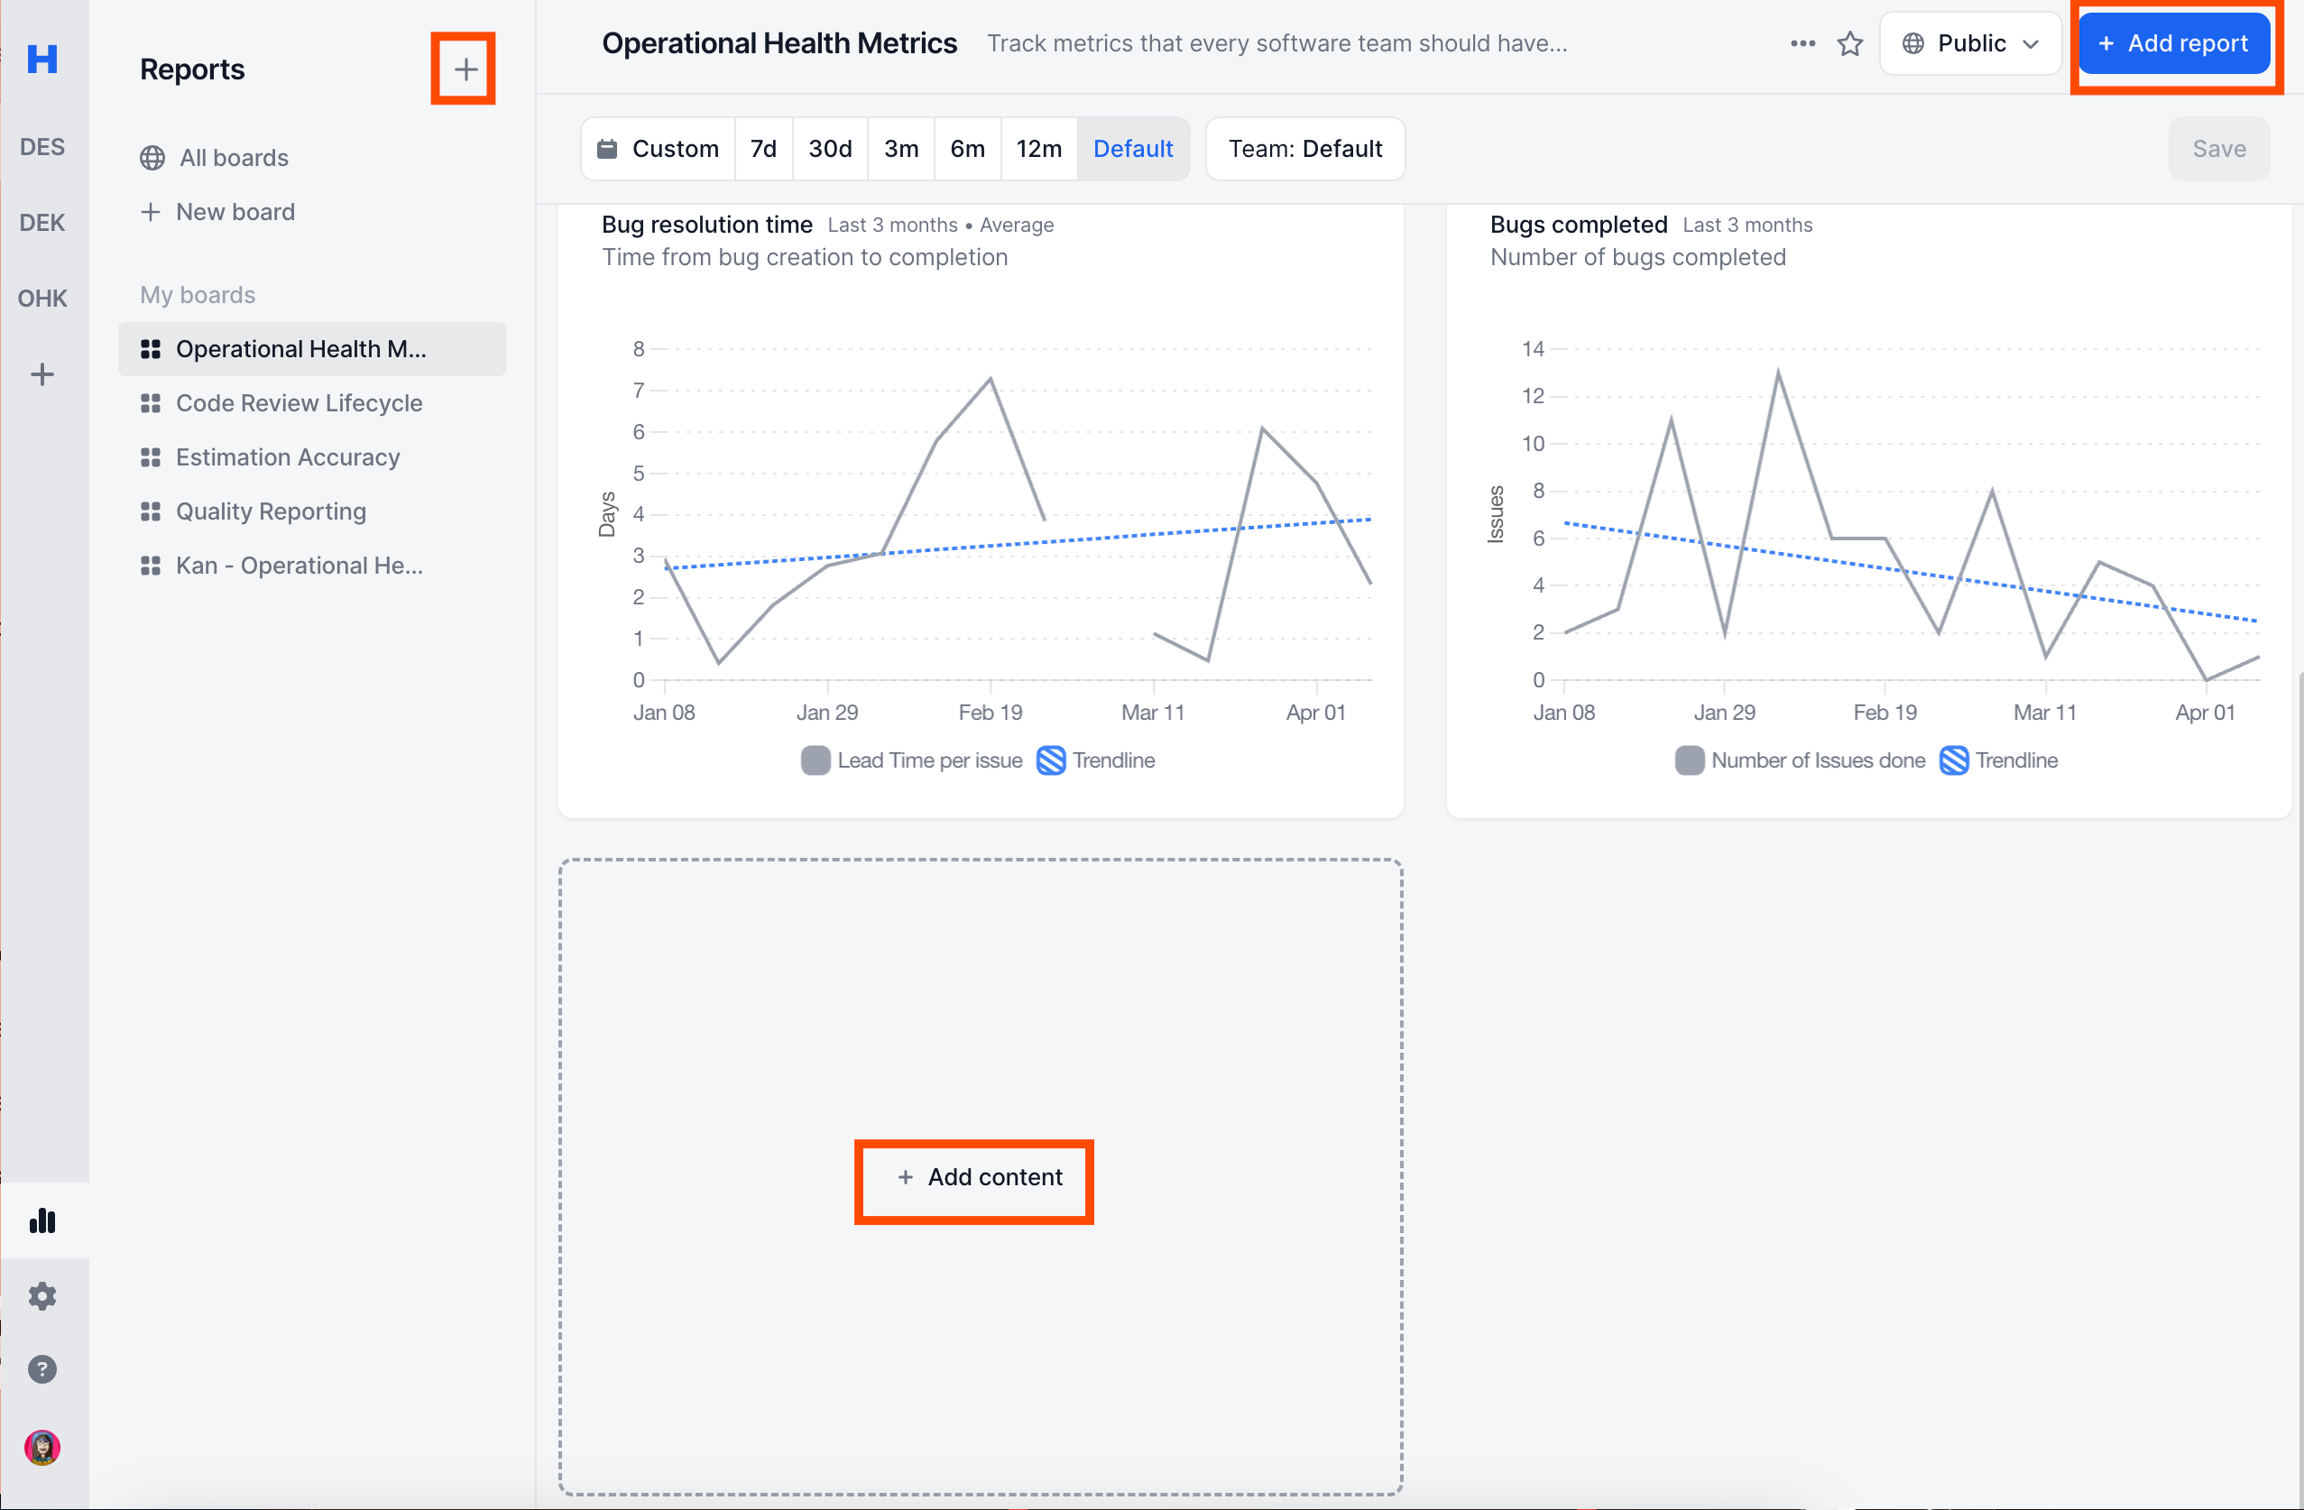
Read more on Team Reports & Flexible Reports
Report Widget
A report consists of 2 high level parts
Data
Visualization
We'll go each of below.
Select metric
Metric section is the basis of any graph.
There are 4 types of entities
Sprint
Issue
Pull Request
Deployments
Based on which time of entity you selected, all the options underneath from calculation method to filter options will change.
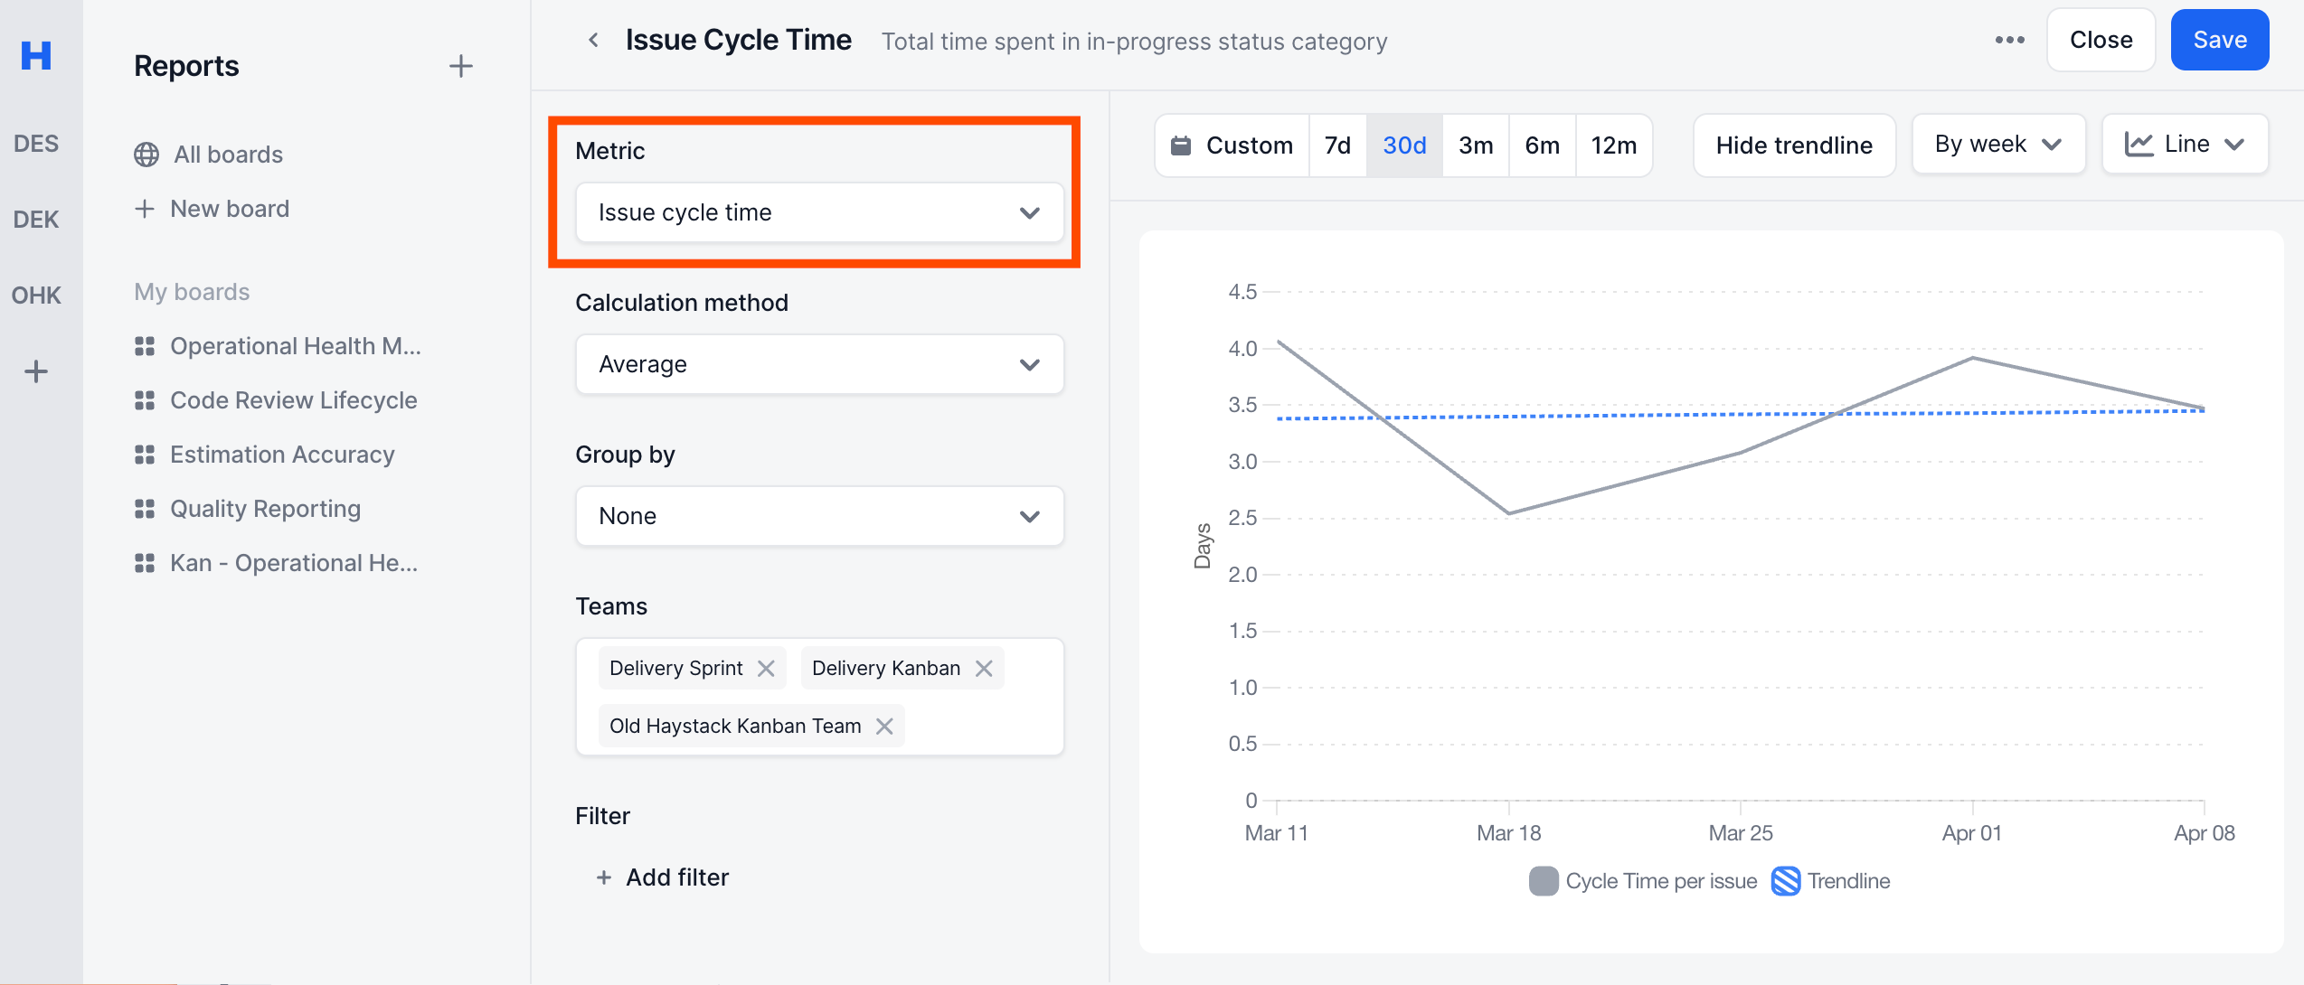
To see every metric in detail check all metrics.
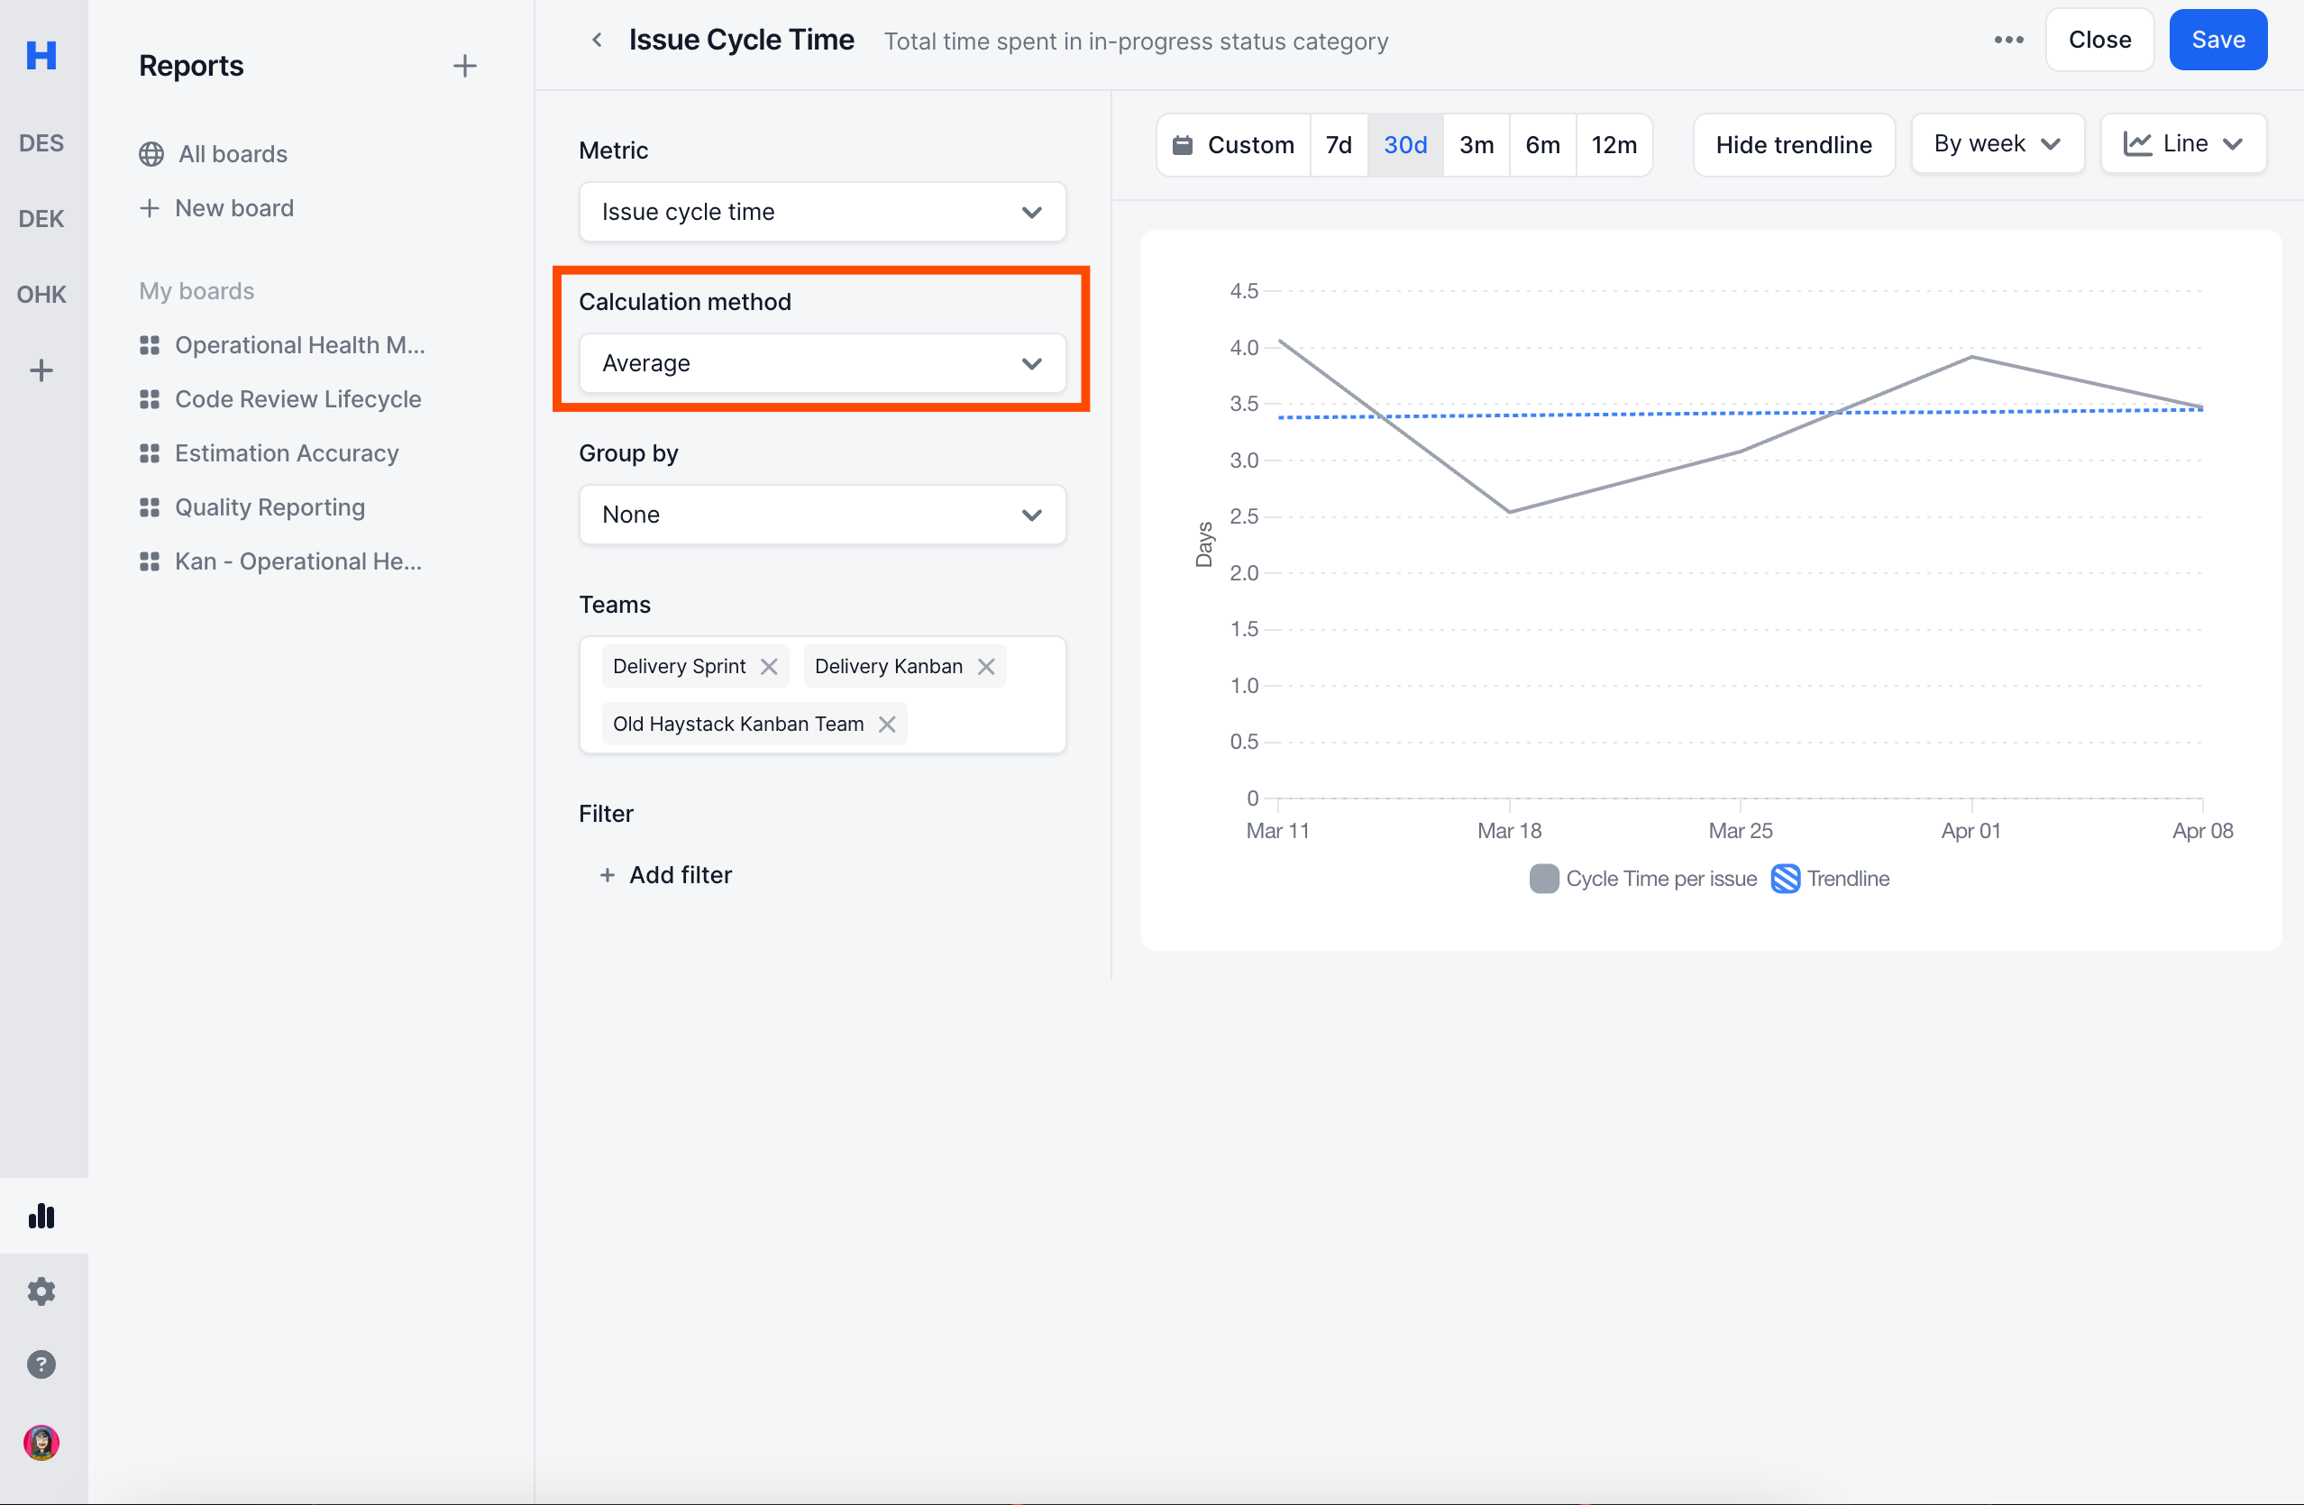
Select calculation method
Calculation method is the aggregation function used to graph.
There are 3 options
Average
85th Percentile
Total
If the metric has only one time of calculation method supported, this field will show empty.
Select group by
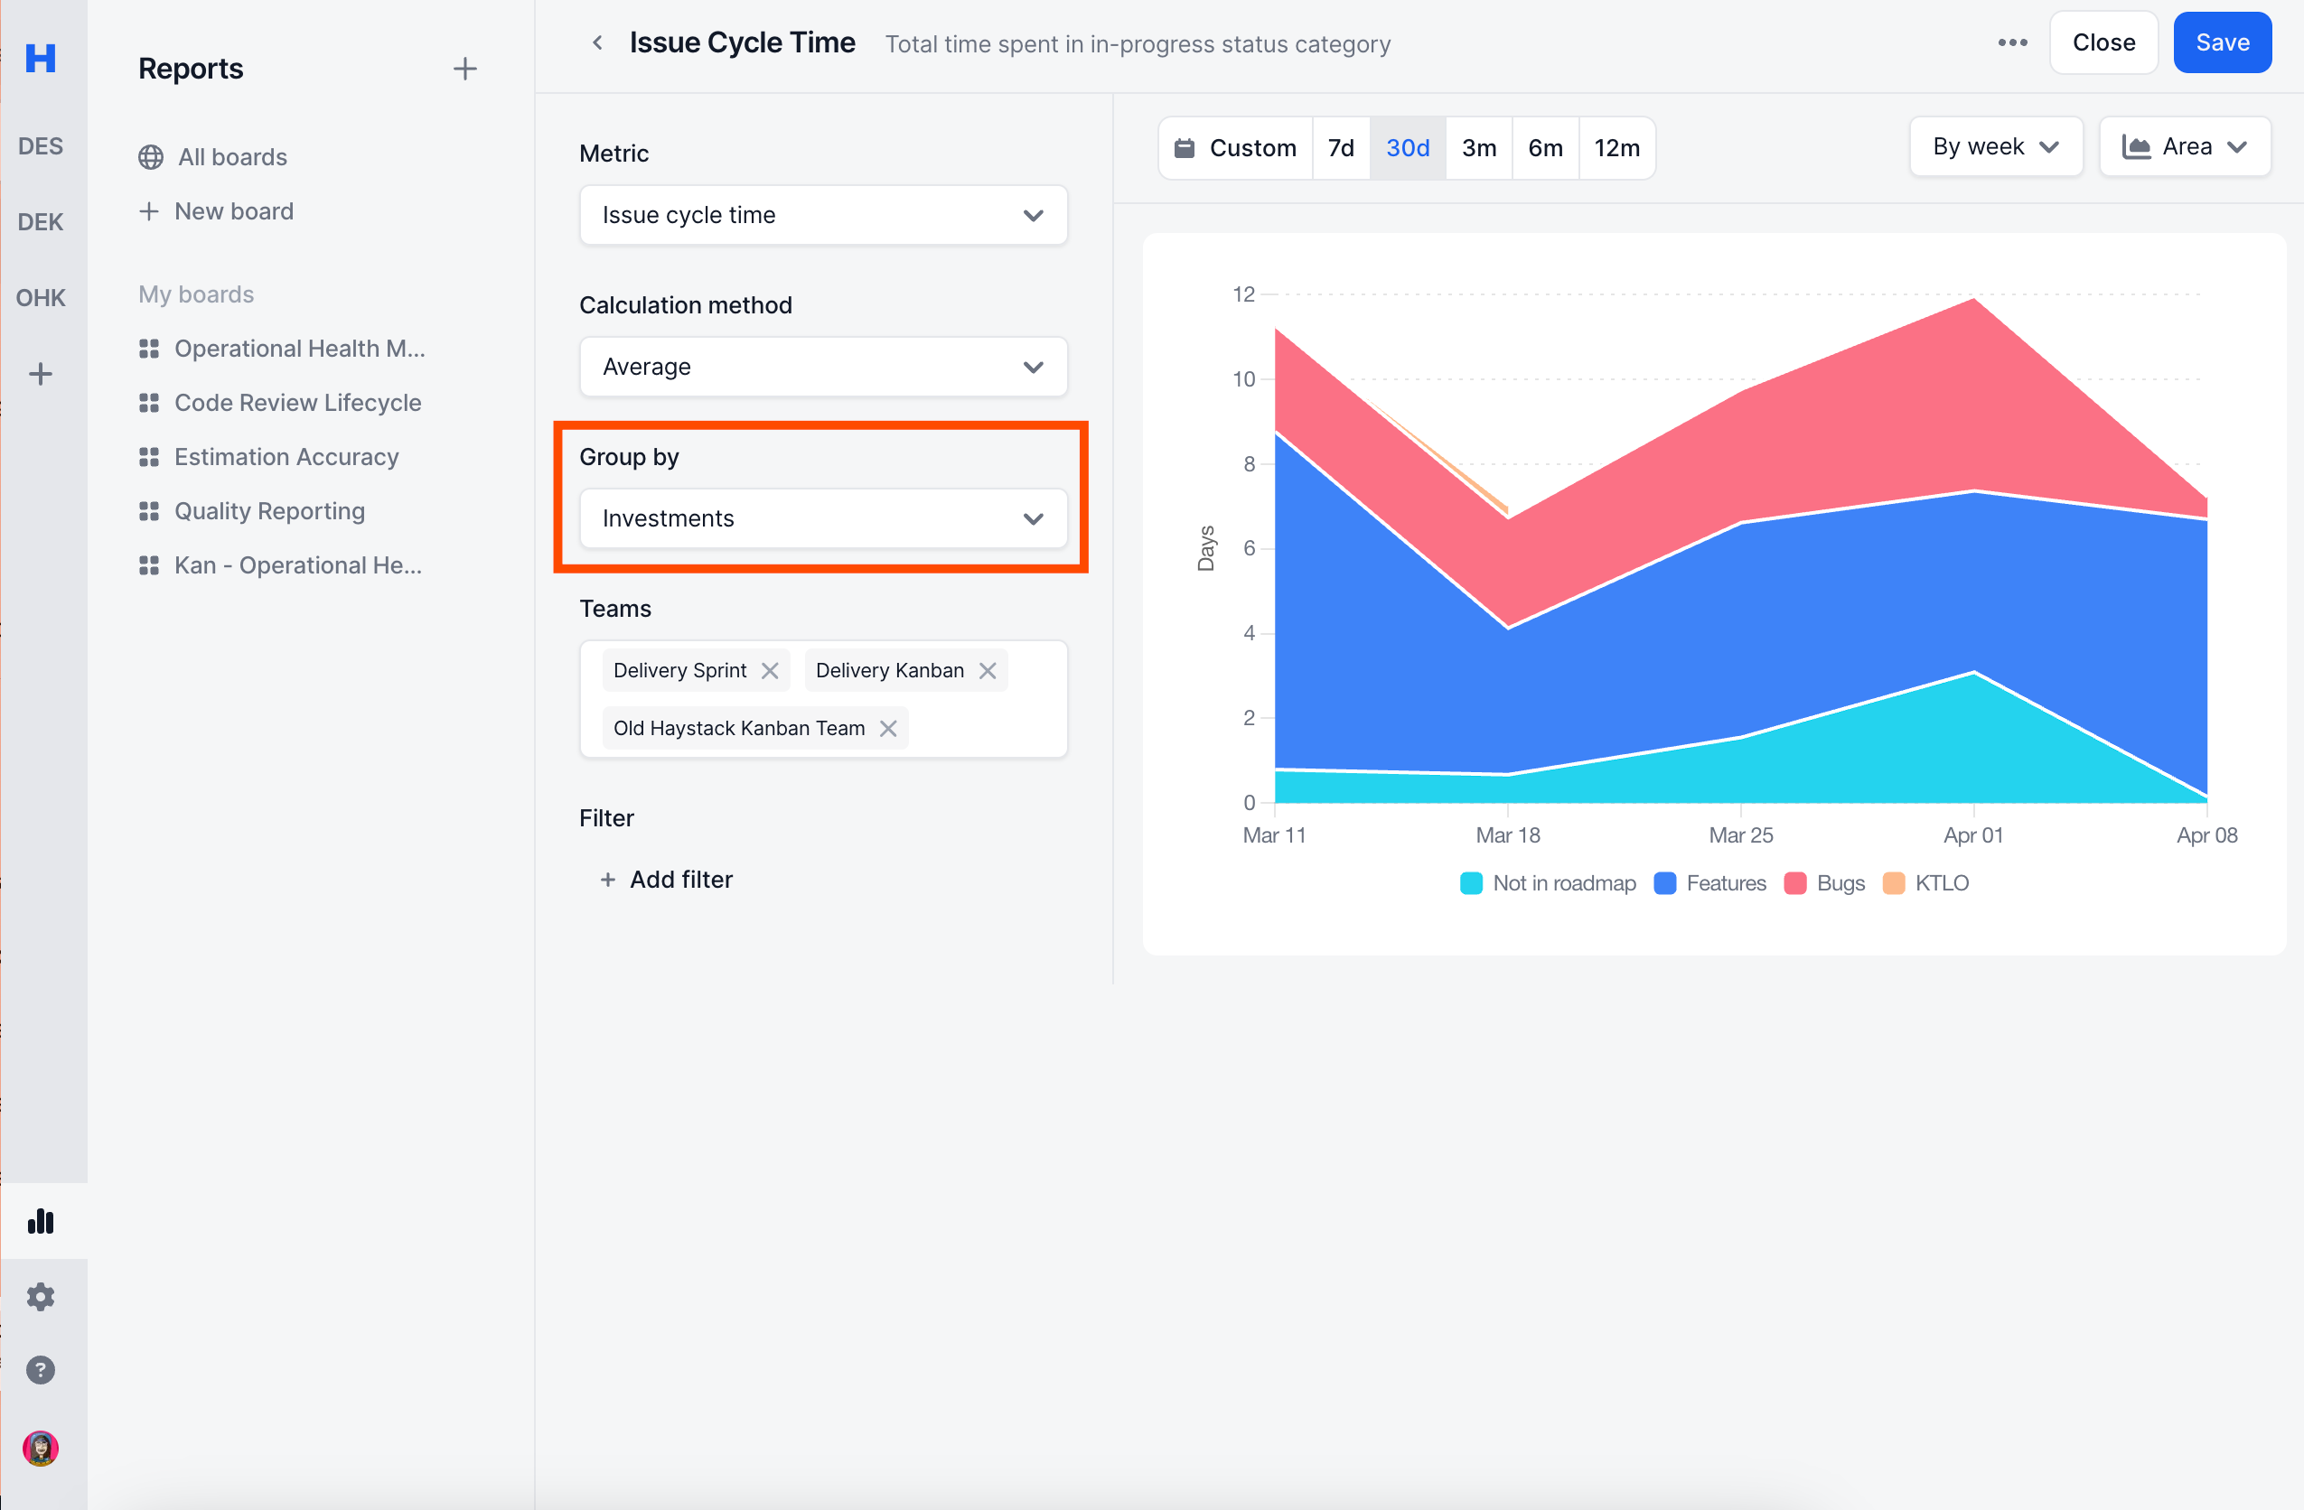
Group by allows you to see divide the calculation into multiple buckets.
Group by options changes depending on the base metric entity type being Sprint, Issue, Pull Request or Deployments.
Select teams
Teams section does the same thing as filters section. It's a hyper specific filter that's put into front for easier usage.
Once you open the dropdown you will see 2 sections
My subscribed teams: Any team you see in your left sidebar are your subscribed teams.
Other teams: Any team that you have not subscribed.
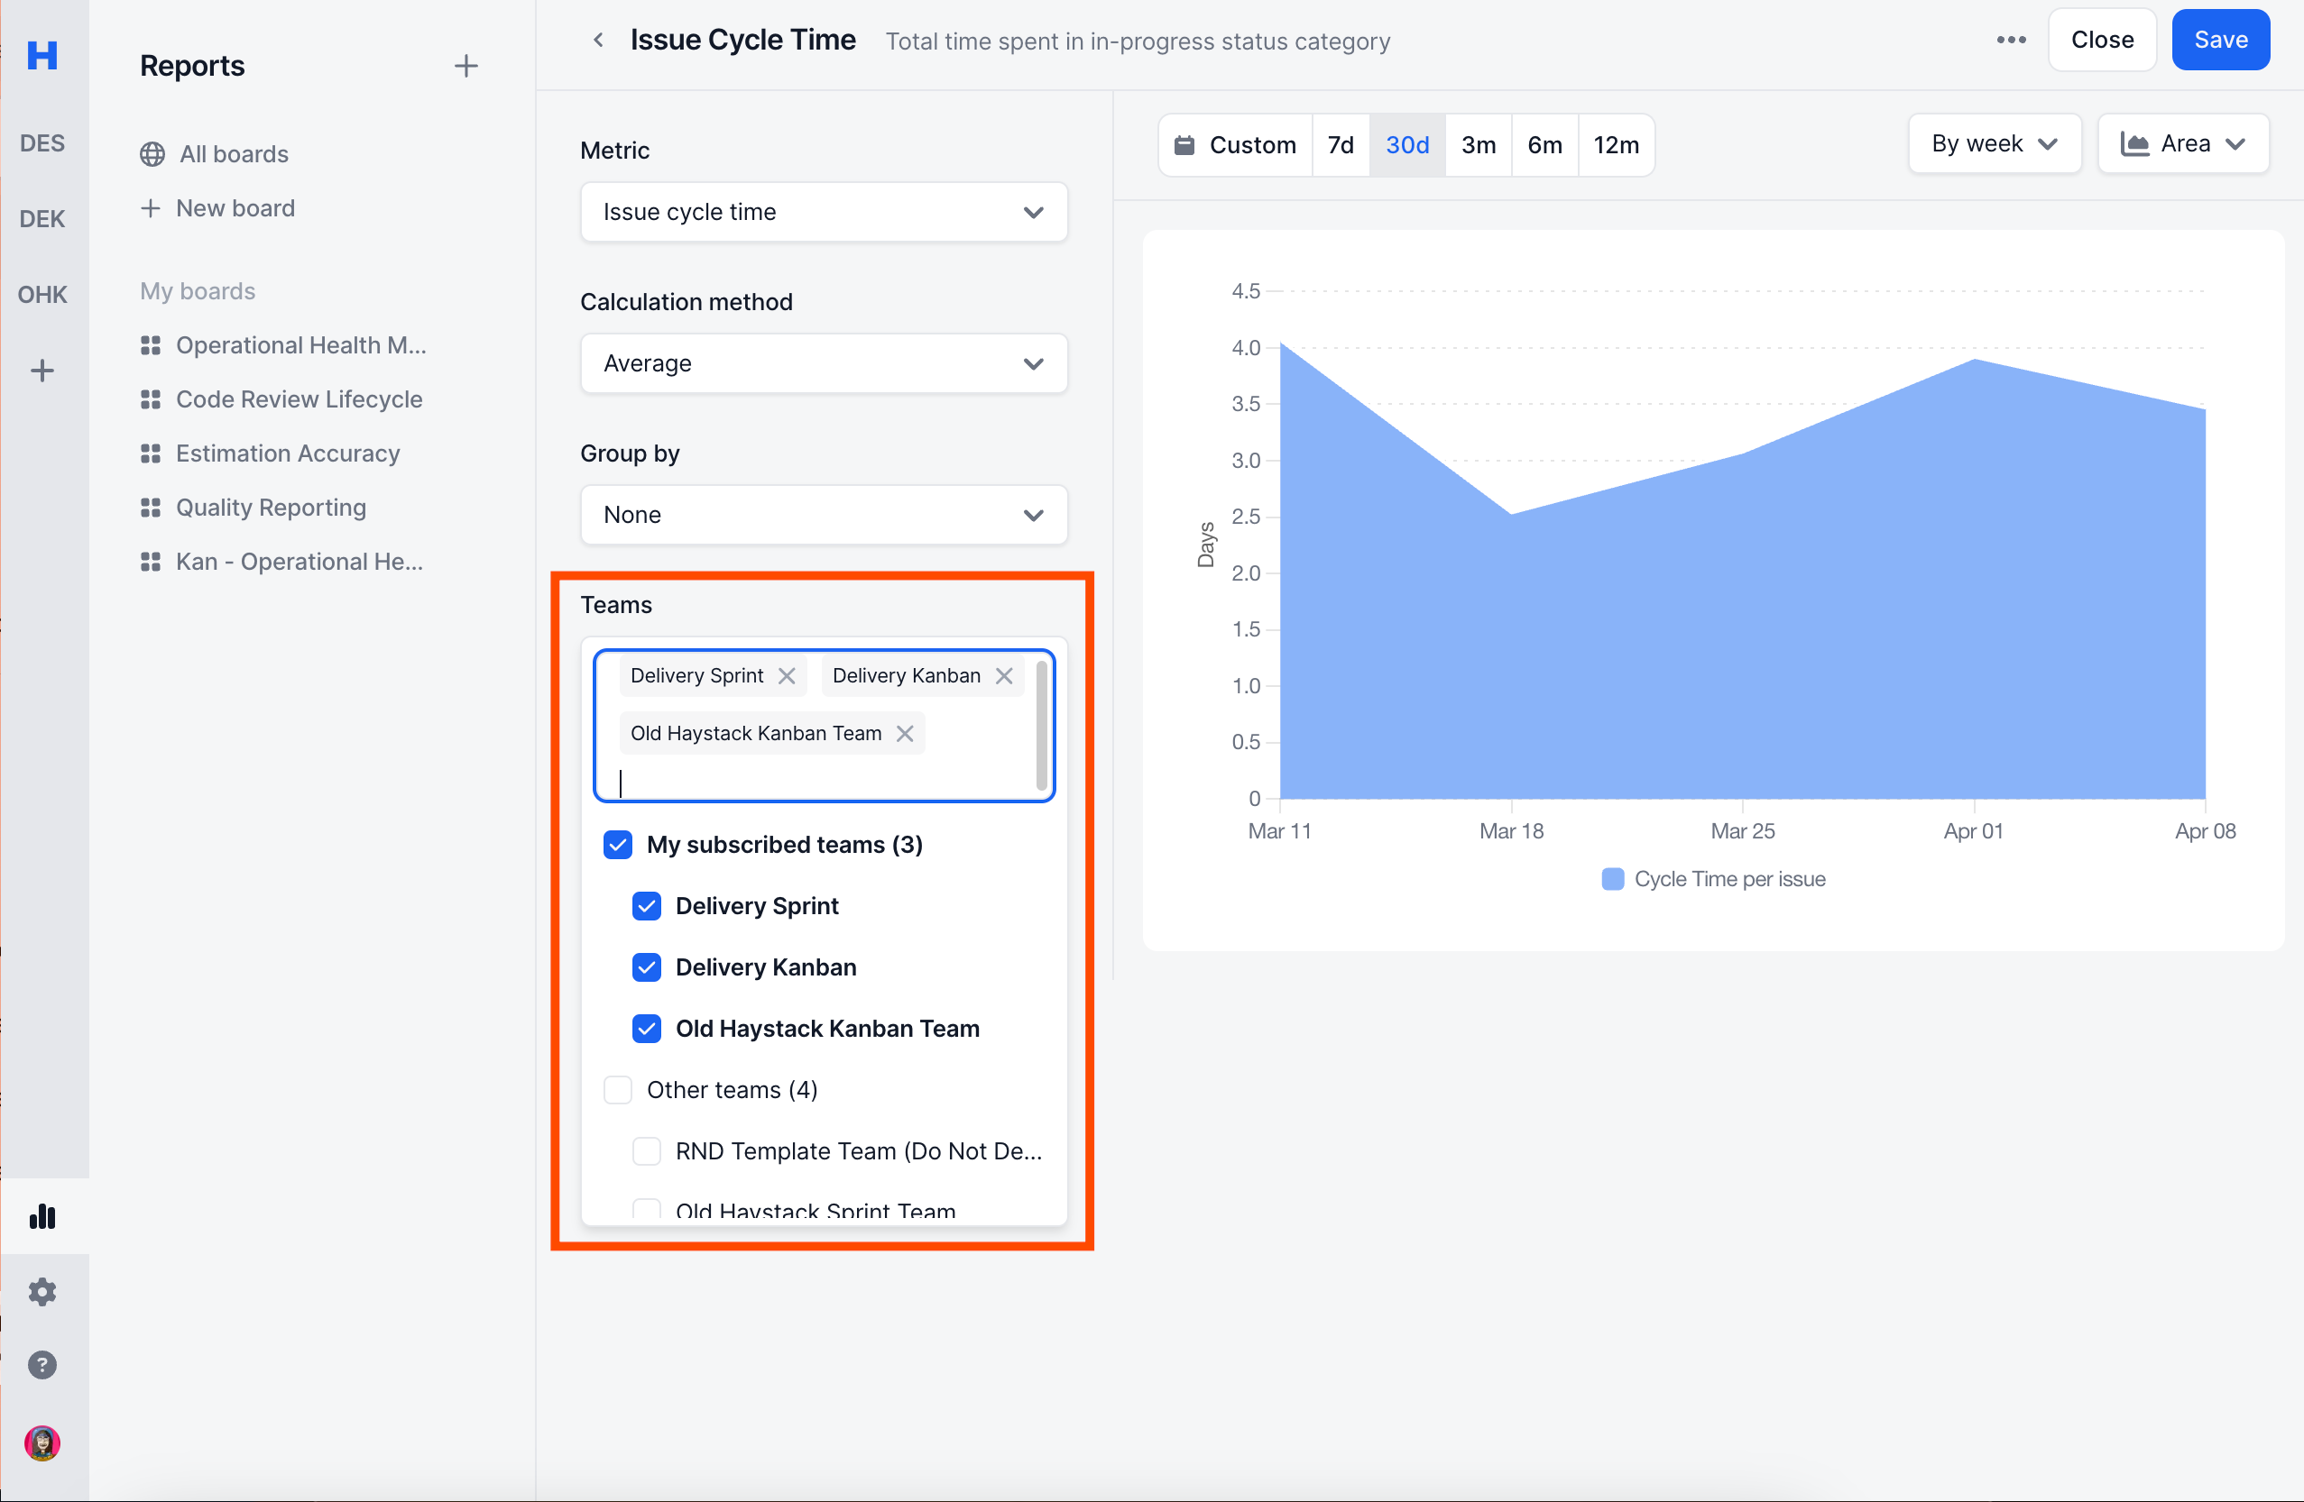
Note:
Reports created in Team metrics does not support Teams filter. It automatically selects the selected team.
Select filters
Allows you to filter the data.
Filter options changes depending on the base metric entity type being Sprint, Issue, Pull Request or Deployments.
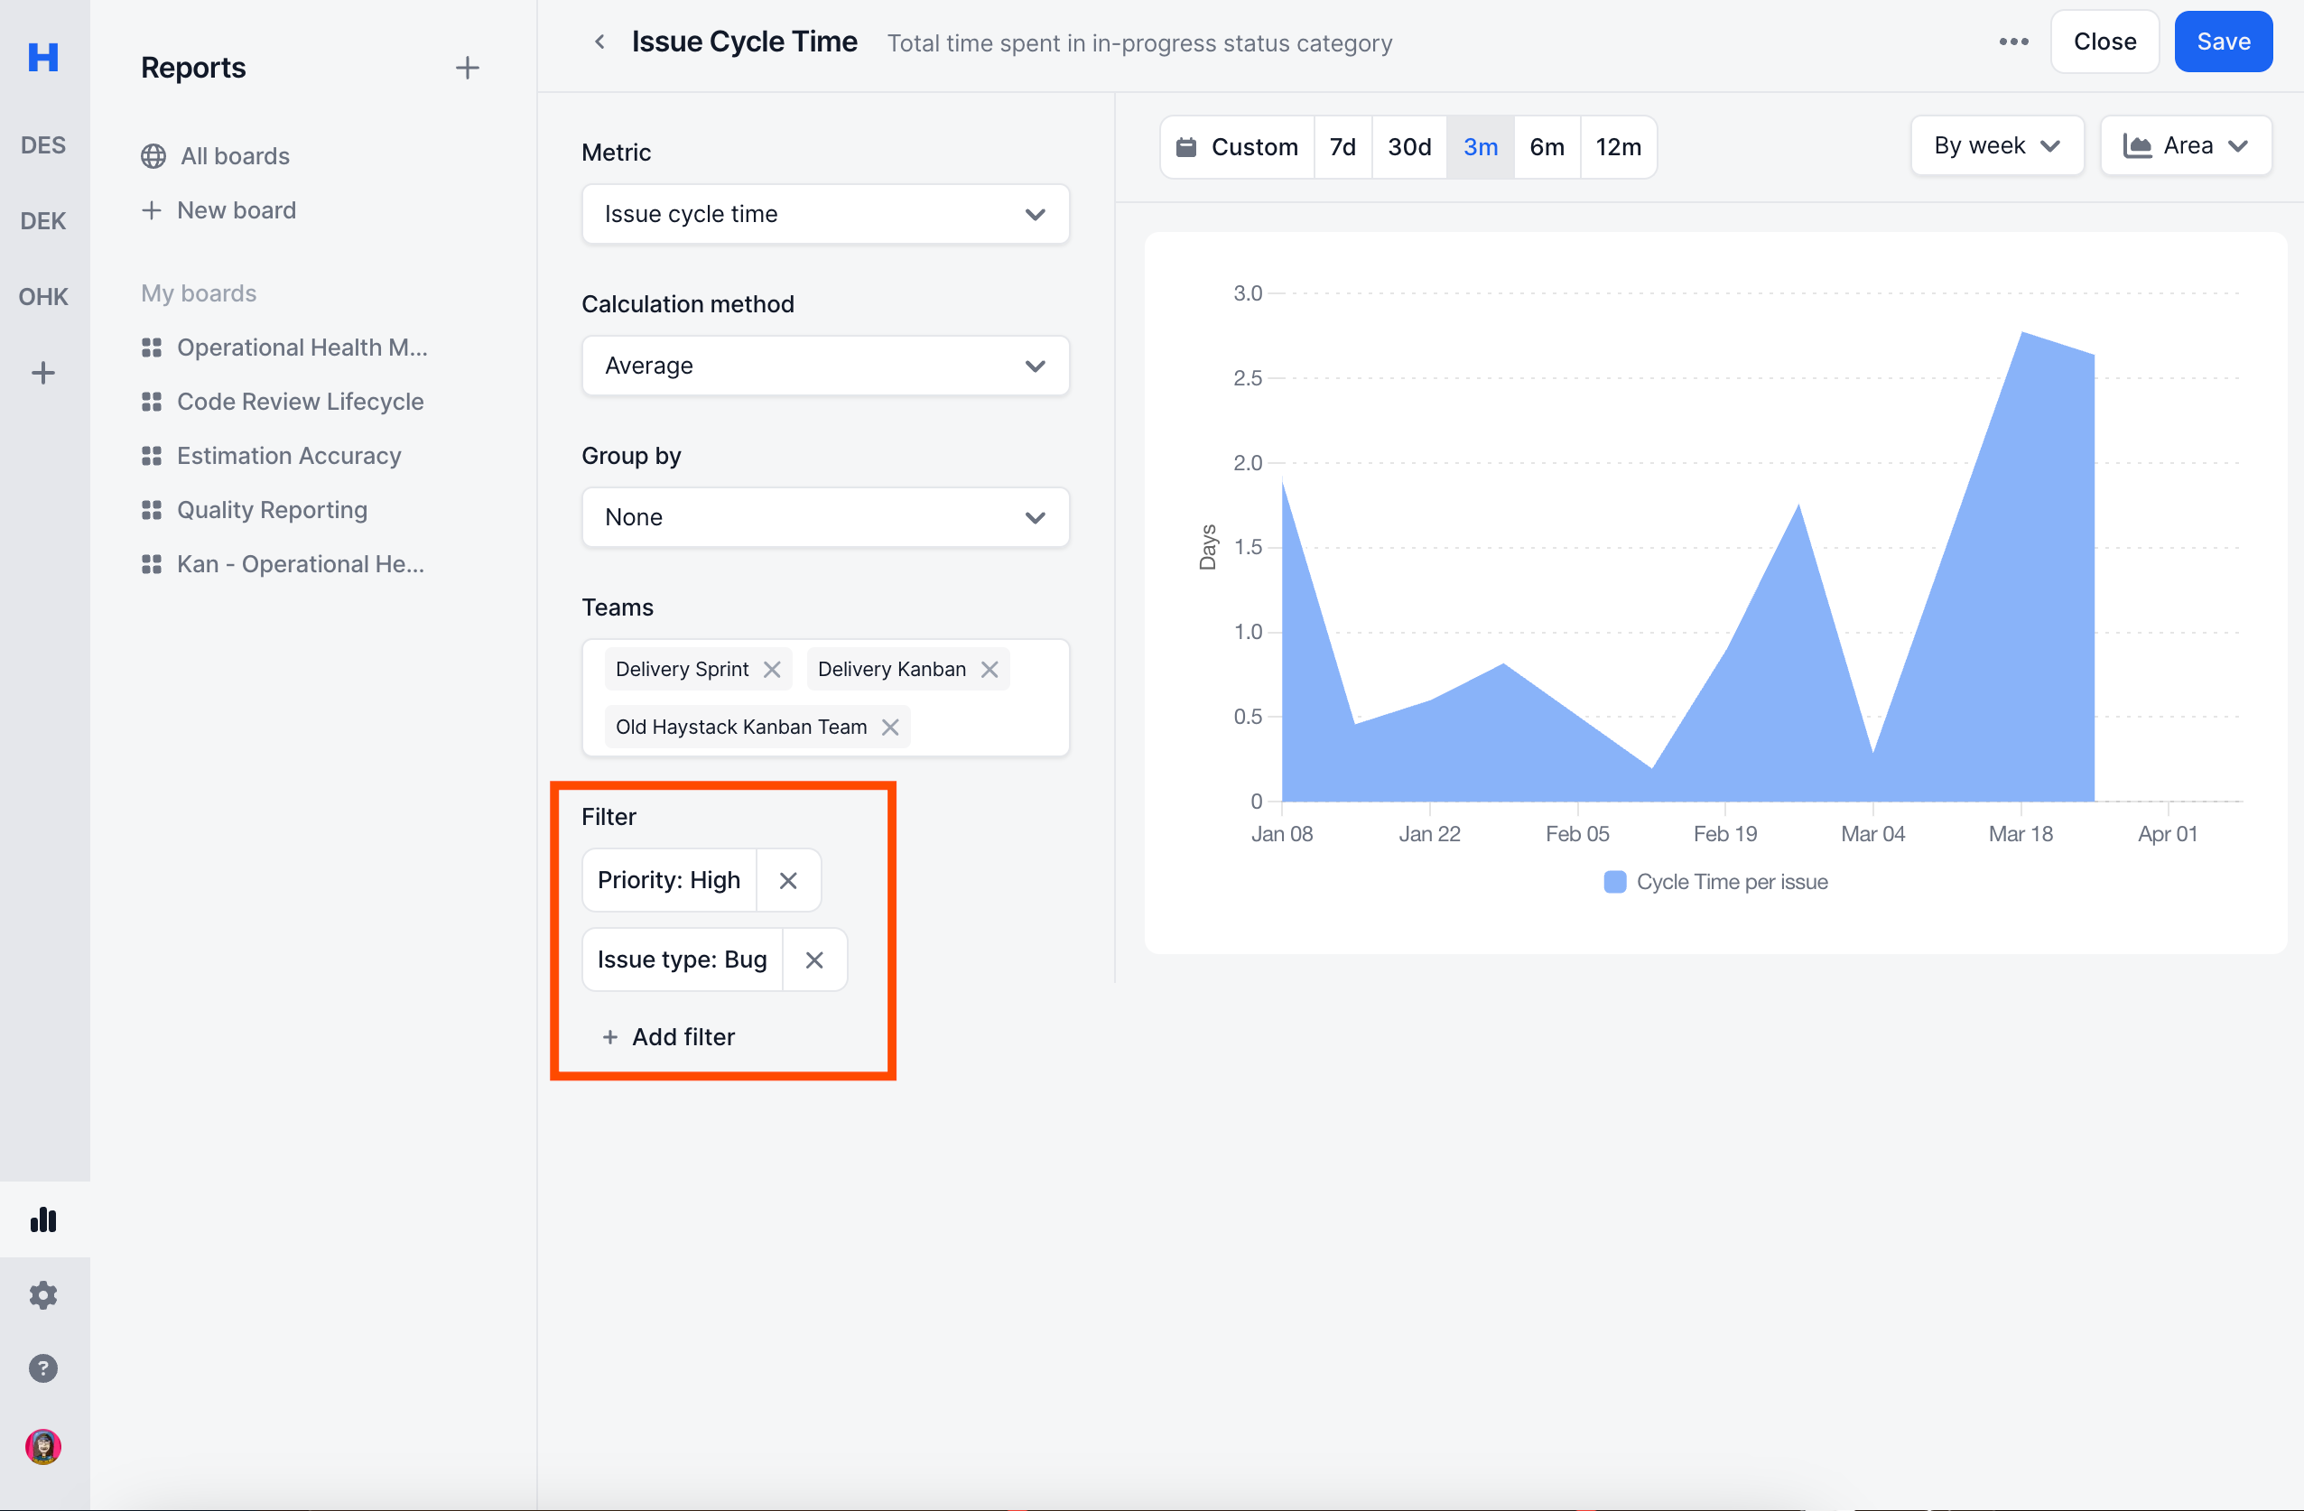
Note:
Filter only supports "filtering in".
It does not support "filtering out".
Select visualization (Graph type)
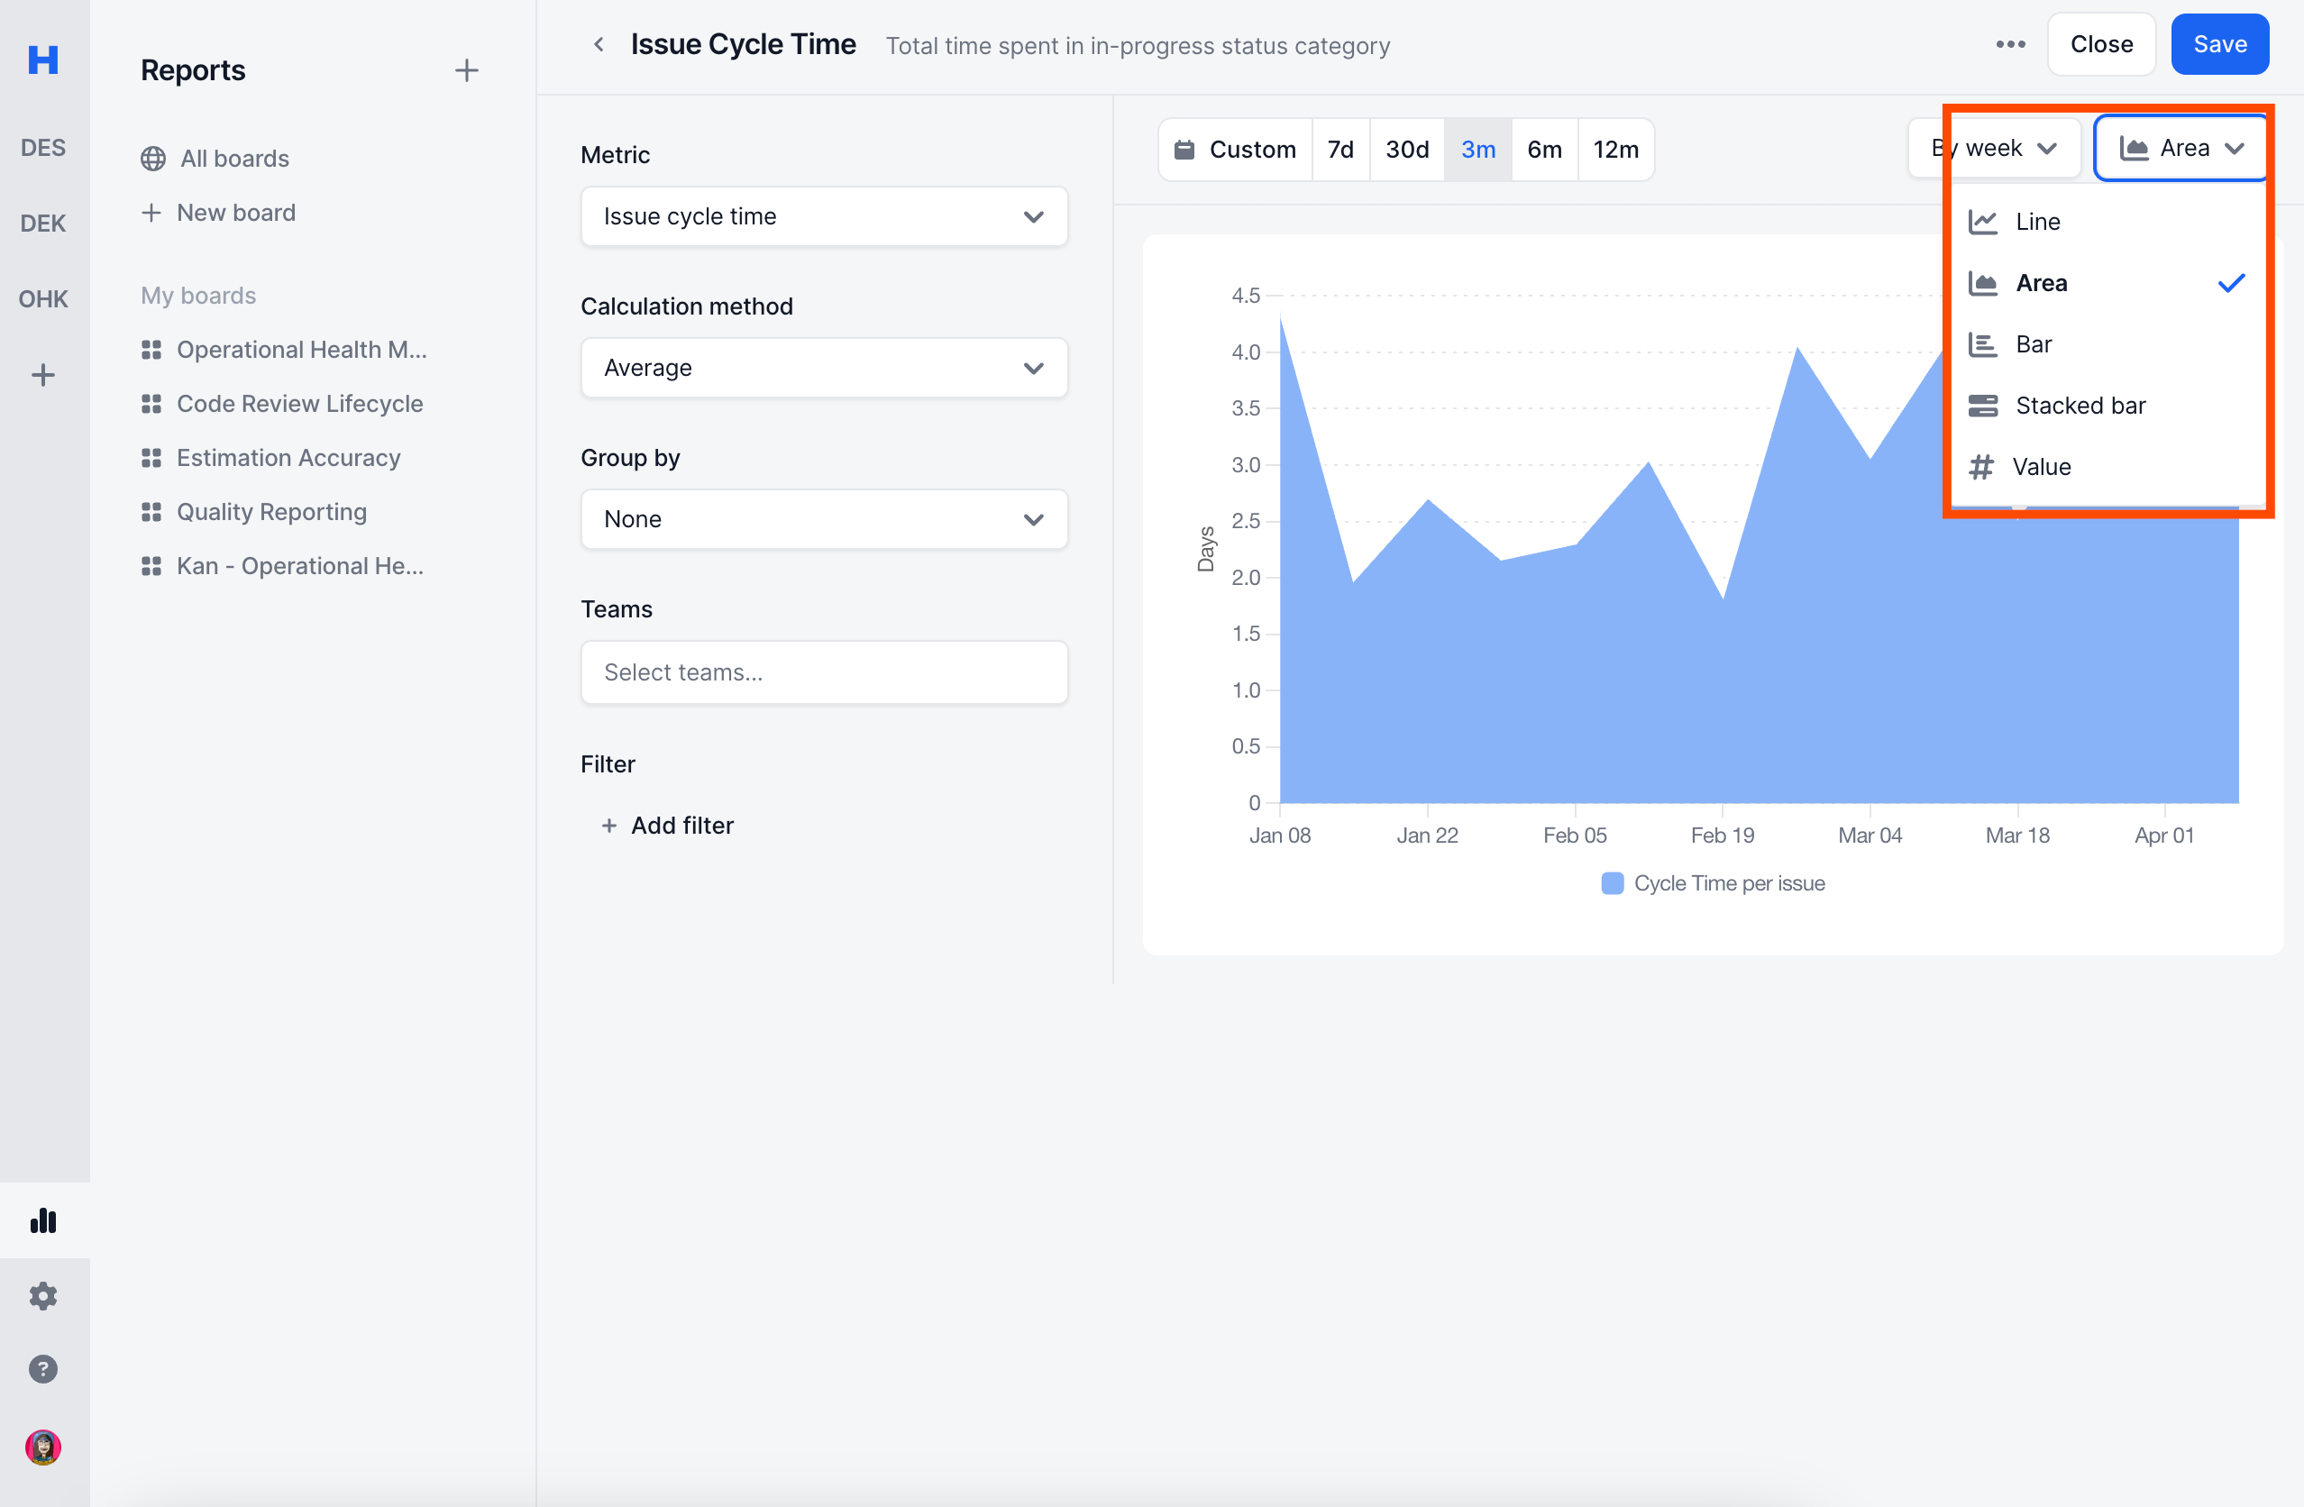
You can visualize your reports in different ways.
The following options are supported
Line
Area
Bar
Stacked bar
Value
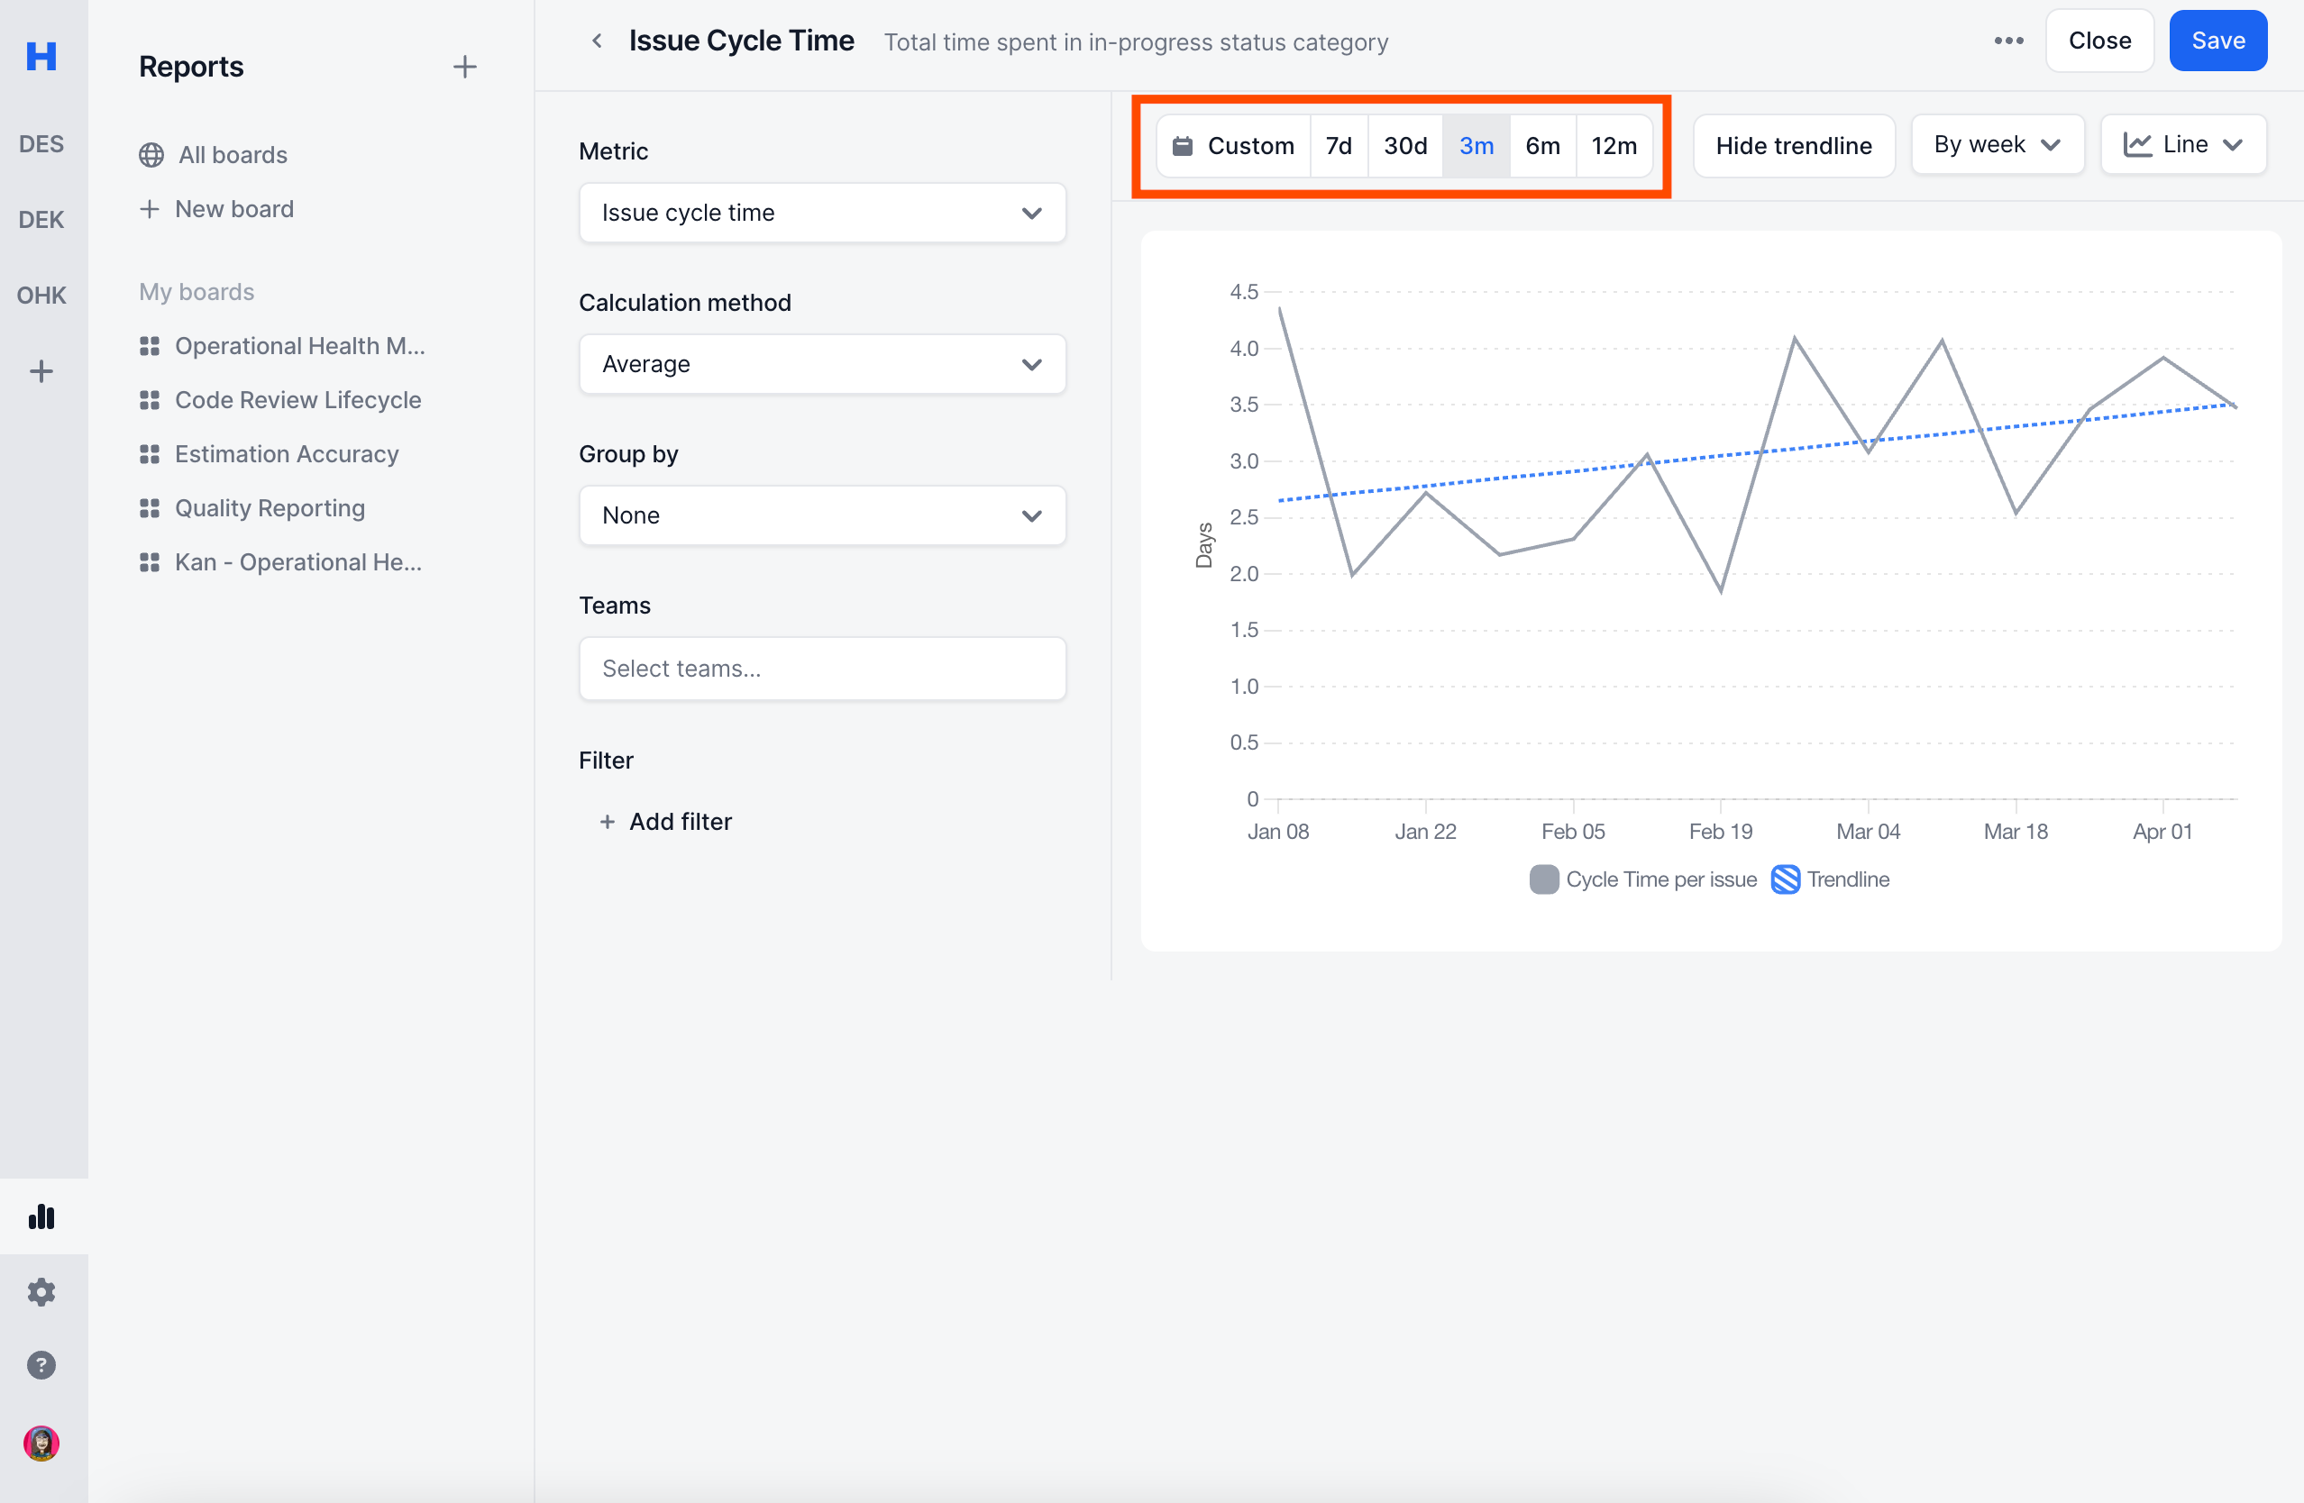
Select timeframe
Time frame or date filter is a specialised filter that filter-in only the entities that were in the given time frame.
It also changes the xAxis for Line & Area charts.
Select graph ticks
Supports 3 options
By week
By month
By quarter
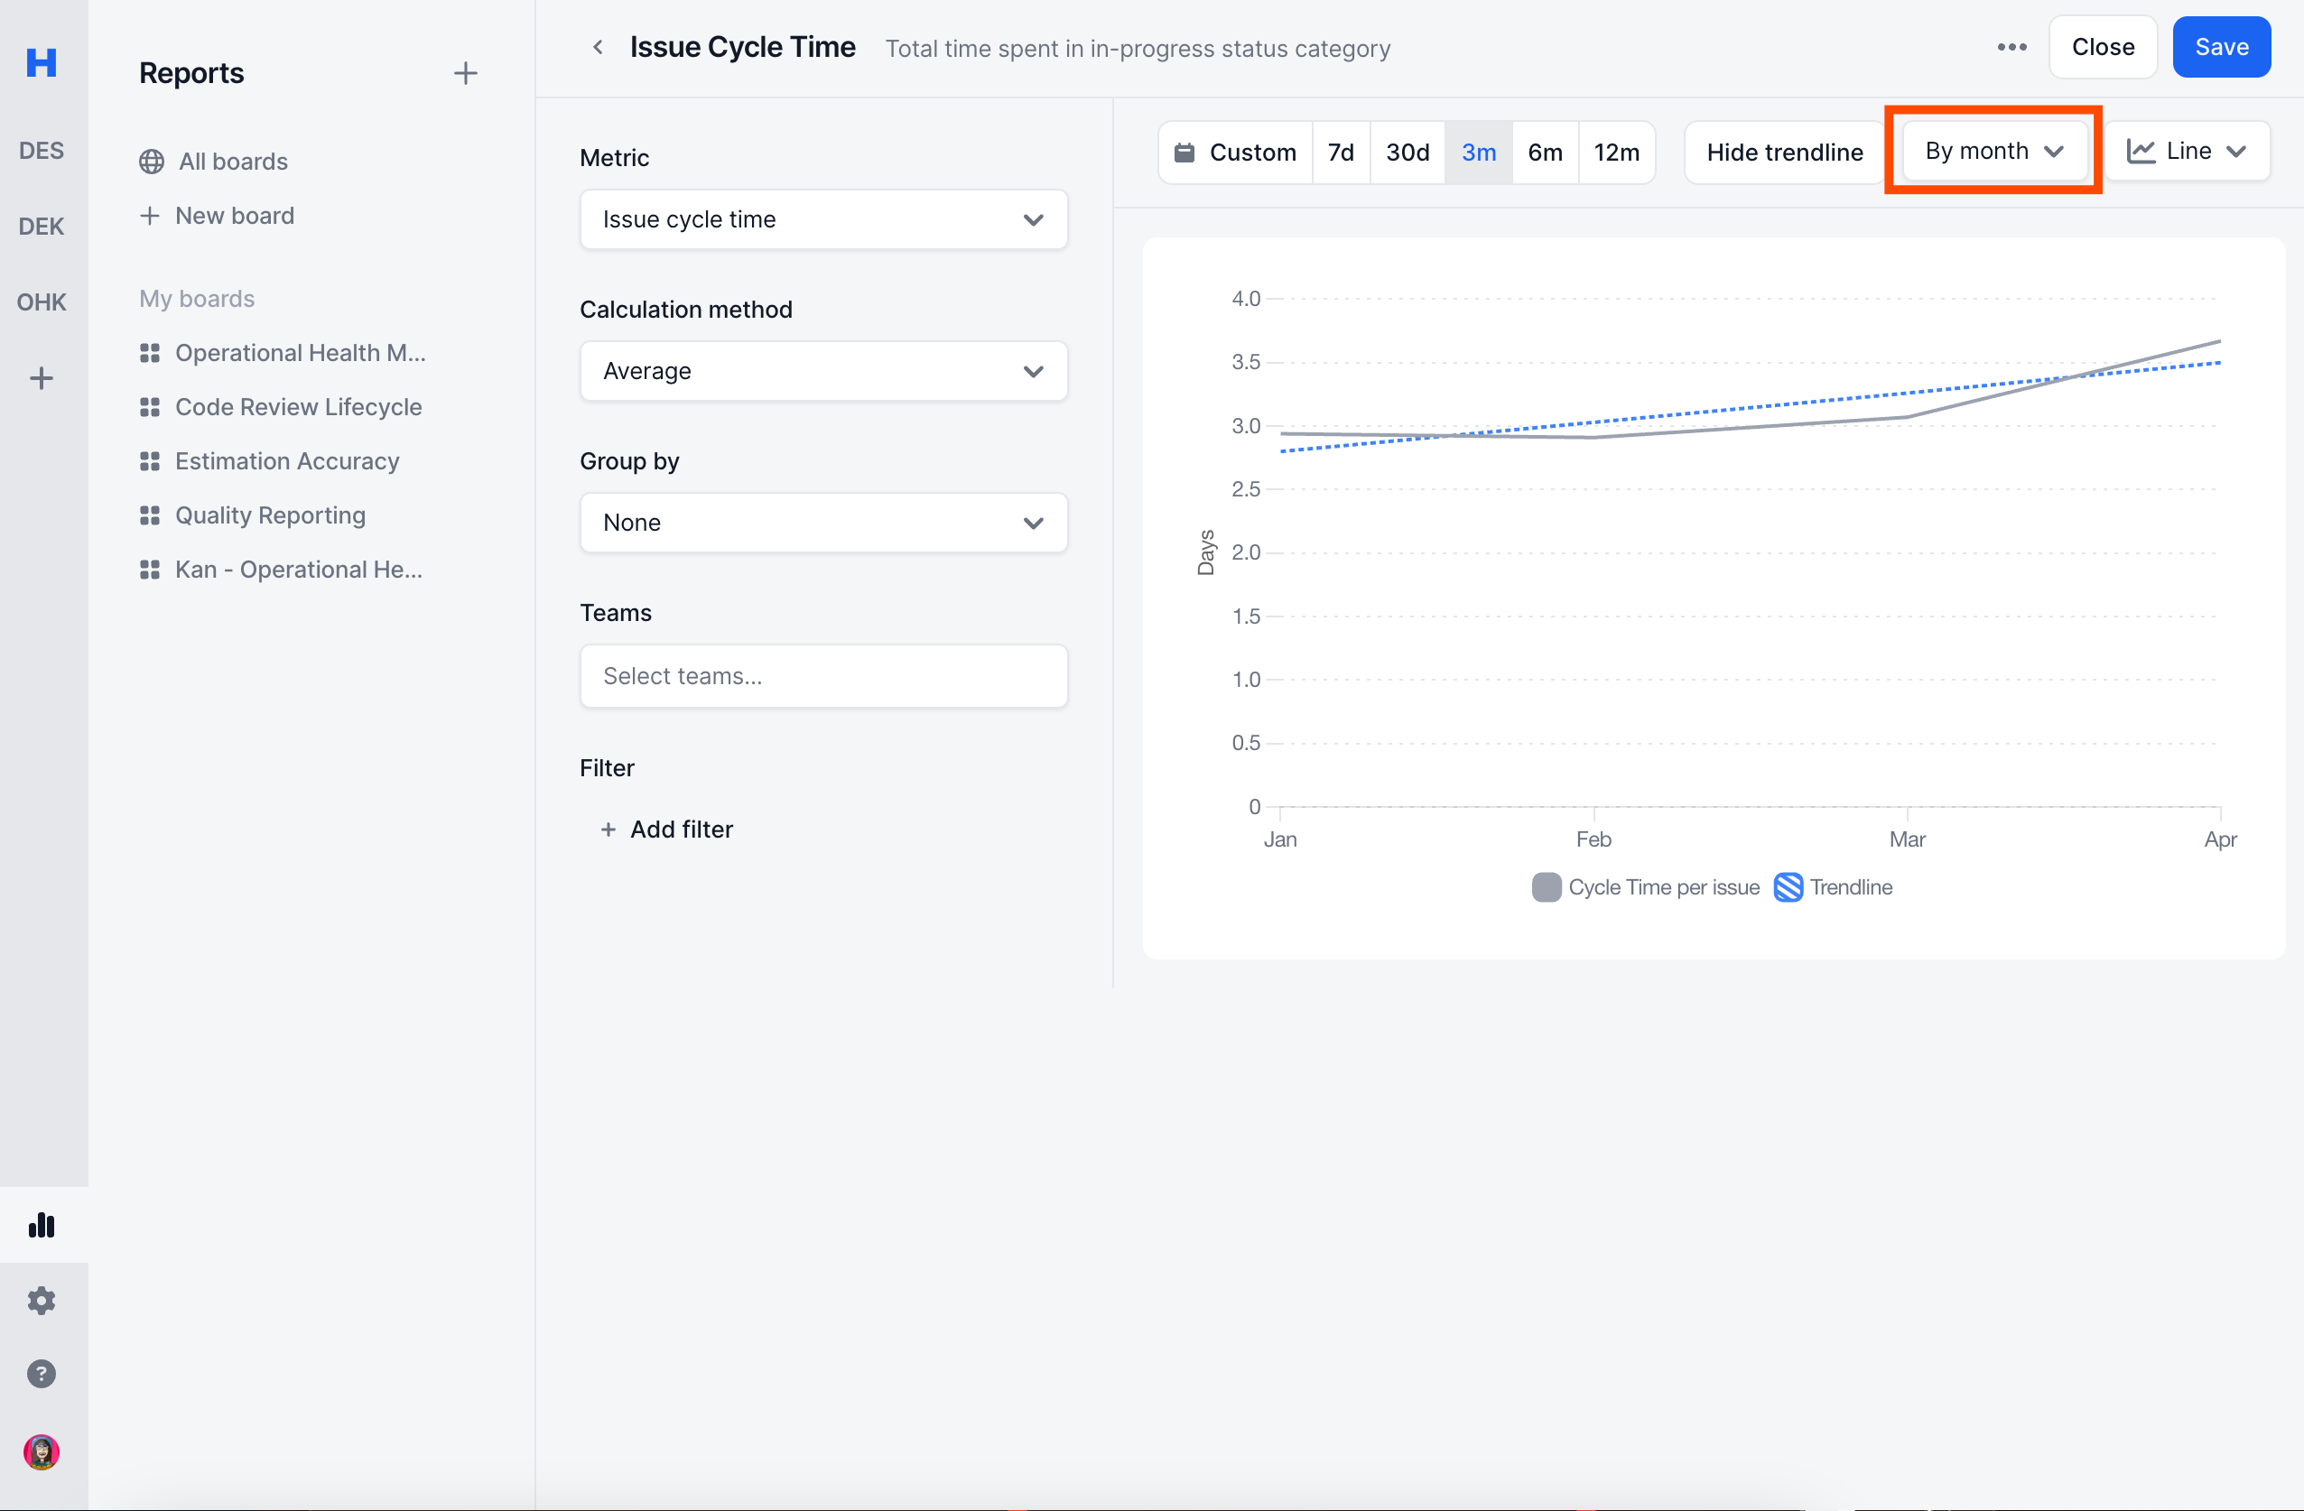
This dropdown does 2 different work depending on the visualization type
For Line and Area visualization types it changes the graph tick.
For Bar, Stacked Bar and Value visualization types it runs the calculation method
per week/month/quarter.
Example:
Issue completed per week - Line Chart
Gives each week one by one
Issue completed per week - Value Chart
Gives the average across all weeks
Trend Line (optional)
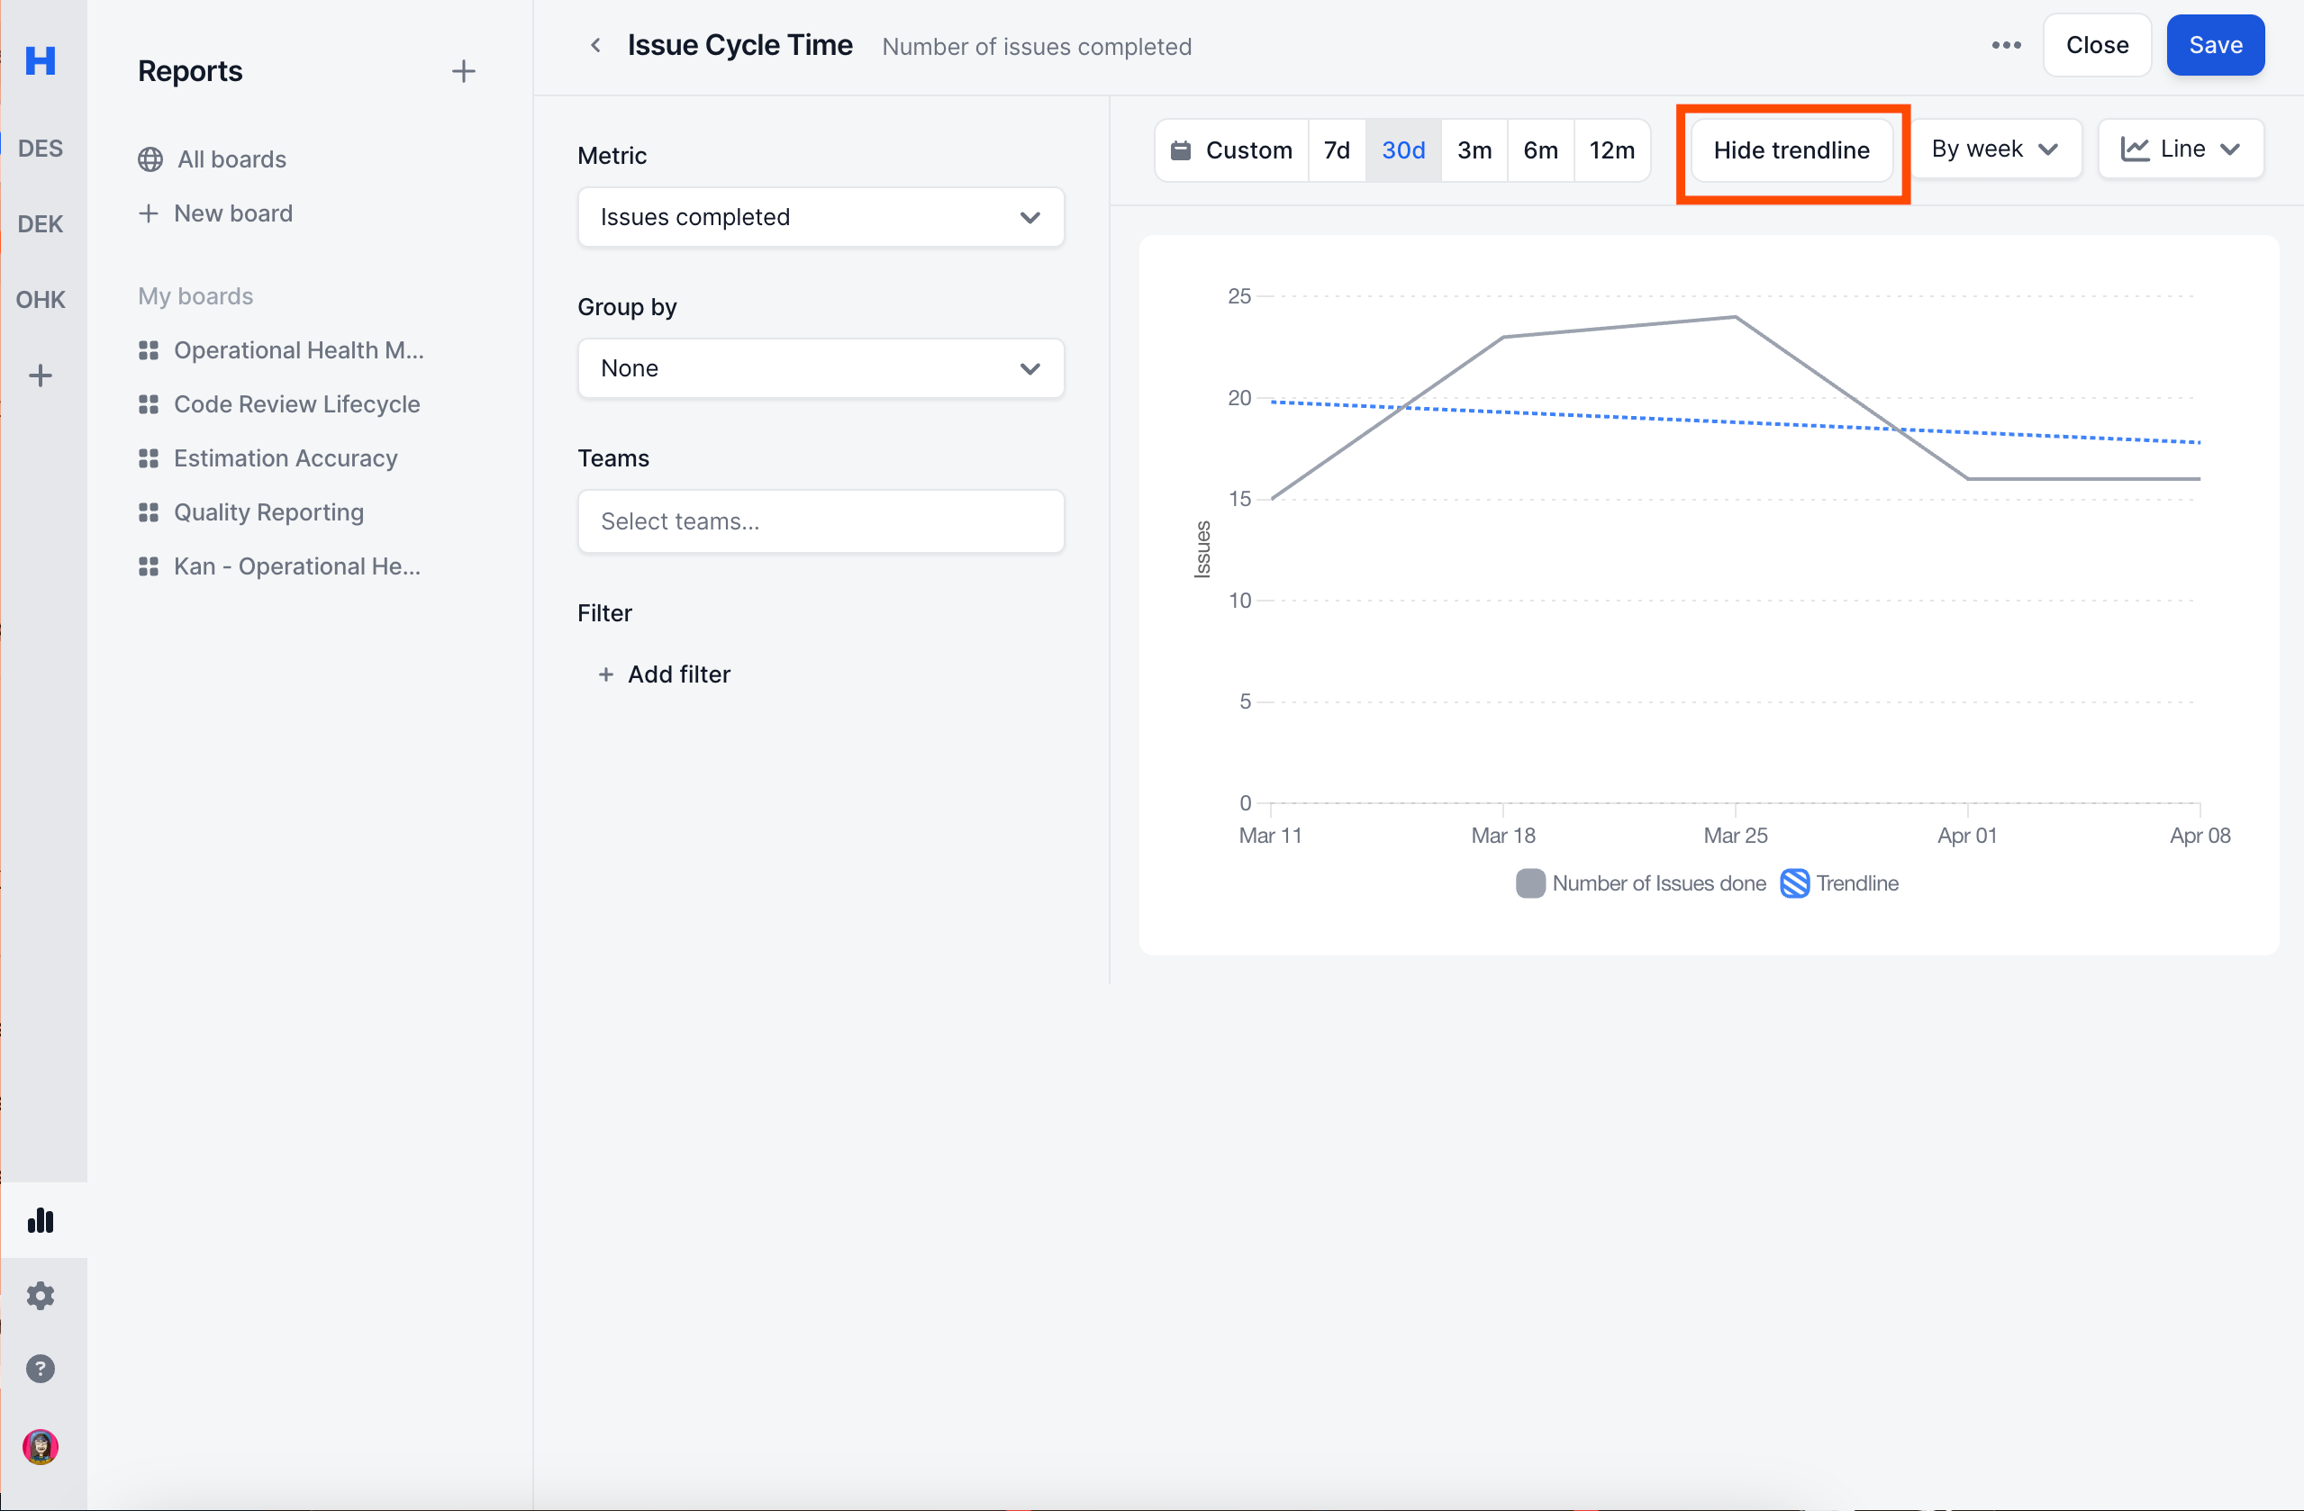
The trendline option is only available for Line chart visaulization.
You can enable or disable it.
Trendline uses Linear Regression.
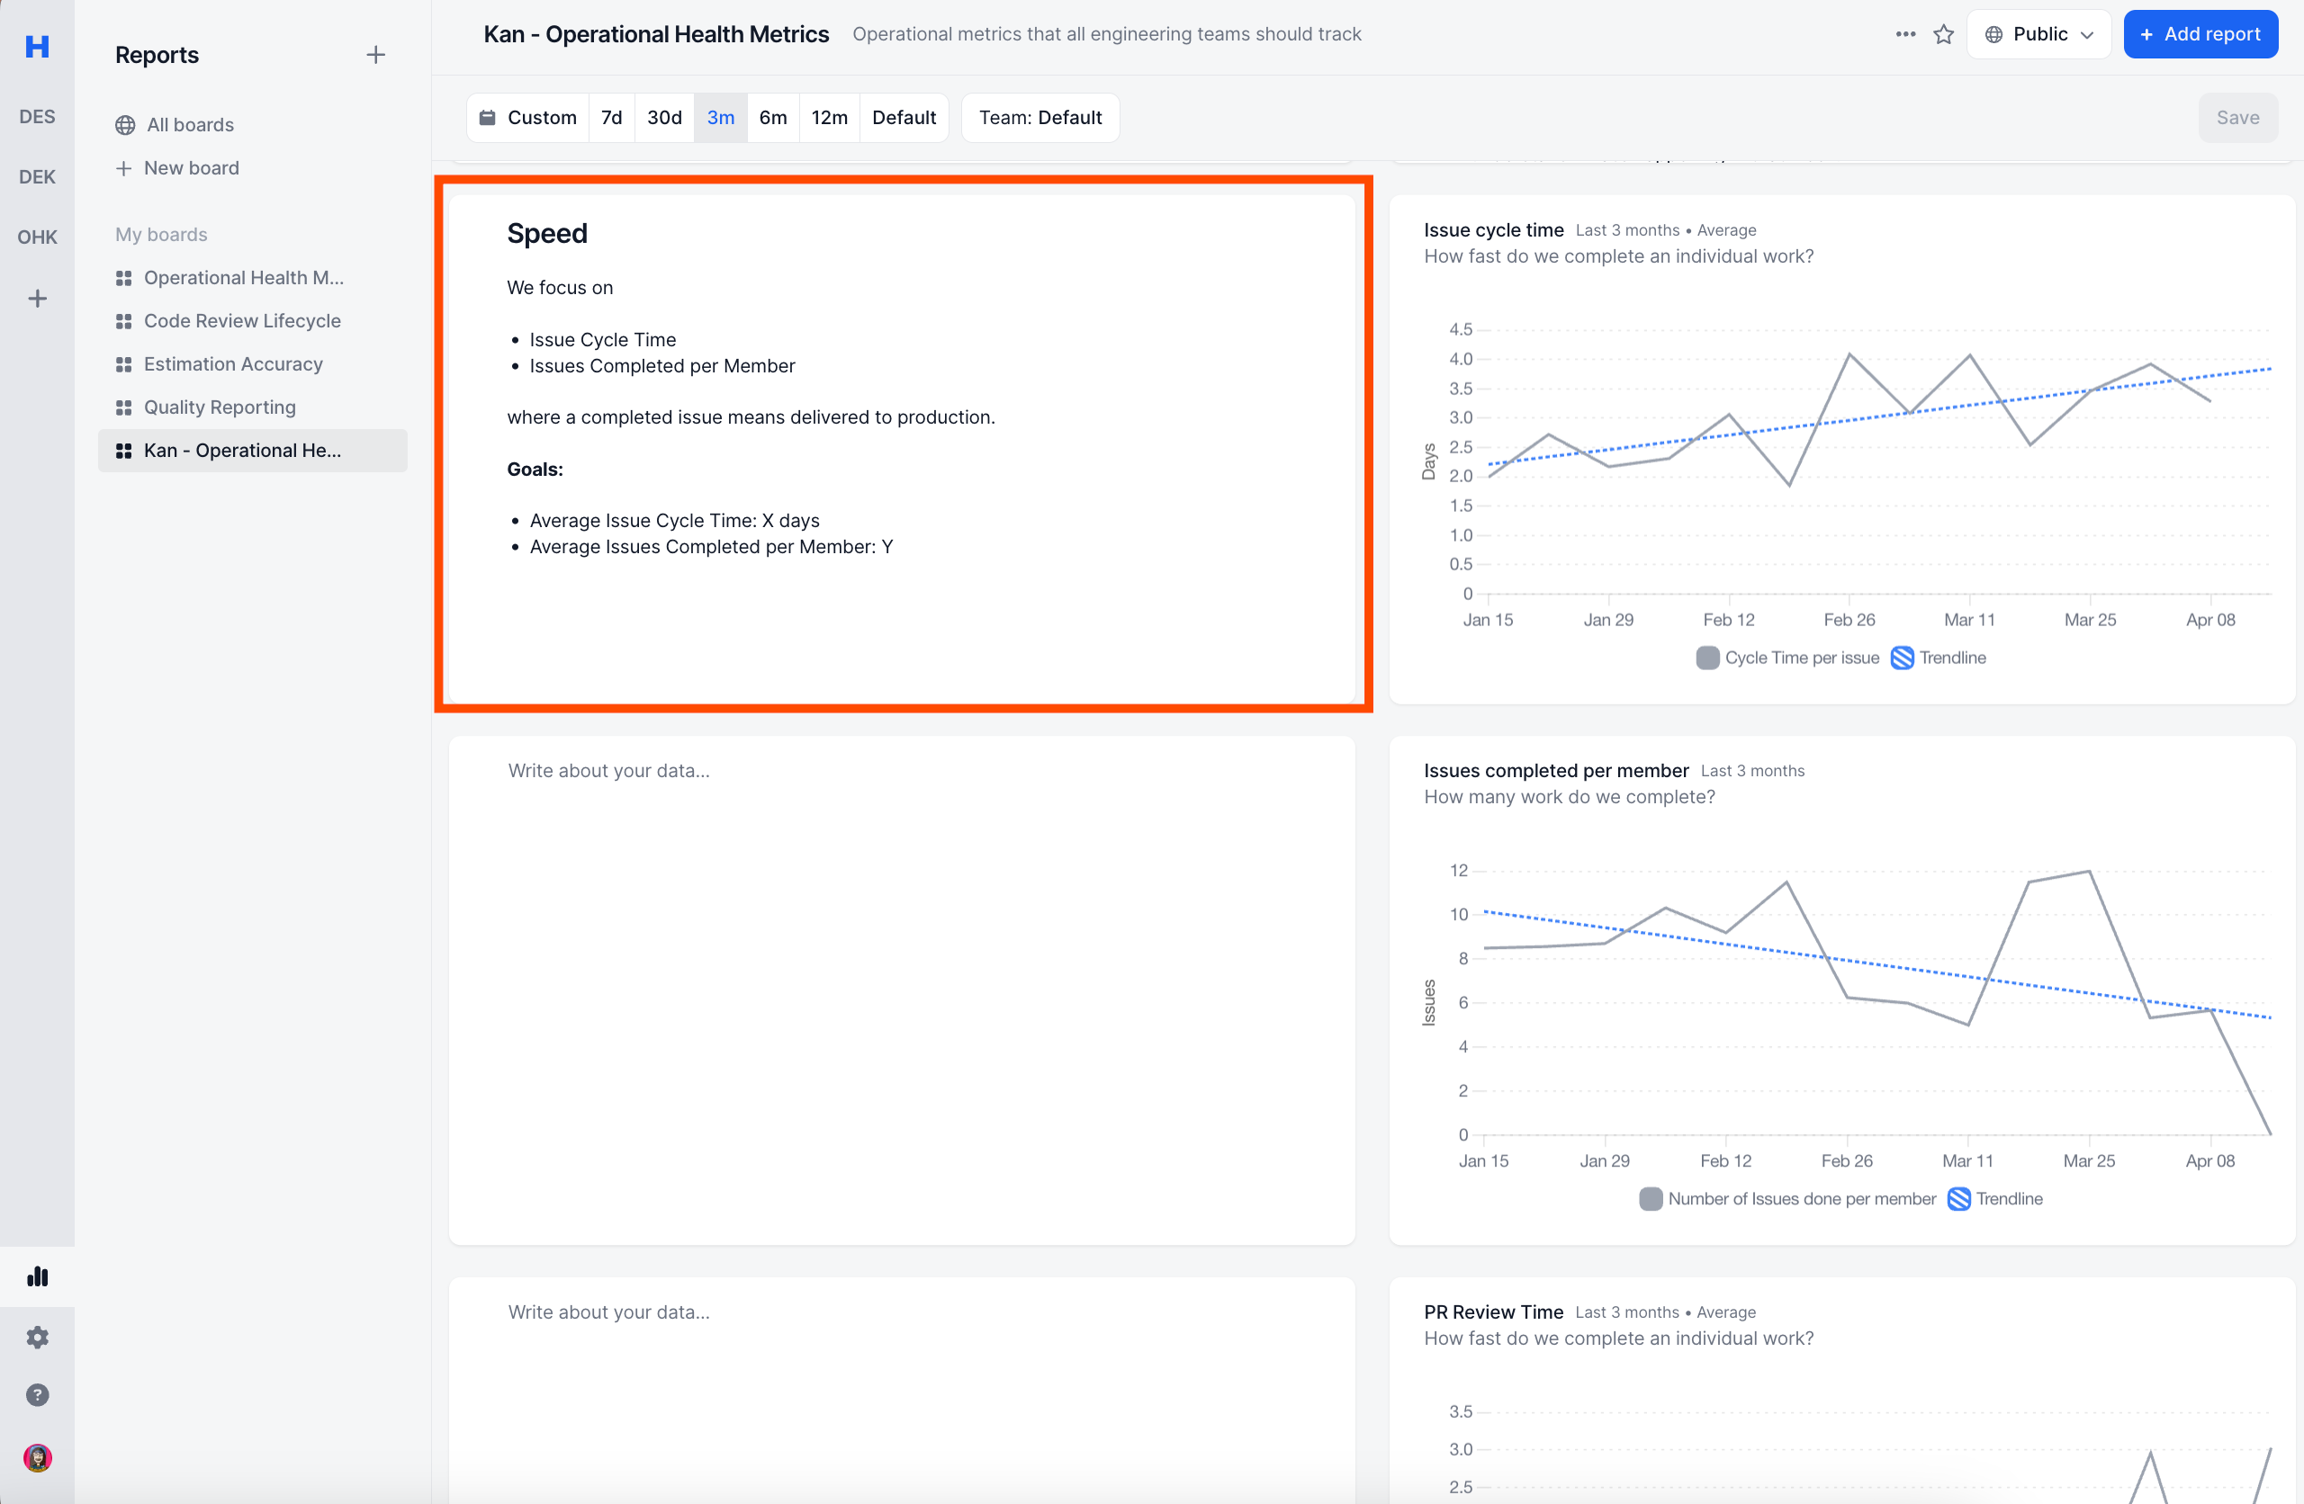
Note Widget
You can create a note widget which supports richtext formats.
FAQ
Is vertical stacked bar chart supported?
No.
Vertical stacked bar has xAxis is time, yAxis is metric.
The same visualization type can be achieved using Area Chart. To simplify the options, we do not support vertical stacked bar chart.
How does the reports handle duplicate data?
Reports work in the following manner
Get raw data
Make raw data unique
Calculate metric
This process ensures no data is counted twice, regardless of what filter you select.
Can I filter out data from the metrics?
No. Haystack only supports filter-in option.
Do you track X metric?
See this page for a list of all metrics and calculations.
How is X metric calculated?
See this page for a list of all metrics and calculations.
Last updated